A Free Lunch?
As more signs point to the US cycle turning up, inflation could make an unforeseen comeback
In recent posts, I introduced the possibility of the US economic cycle turning up again (e.g. see “A Heretical Thought” and “Preparing for the Cycle to Turn Up”). With more data from labor and housing markets, the evidence for this view continues to accumulate
I had predicted an inflation decline in several posts since the beginning of the year, and yesterday’s US core inflation print was indeed seminal, down to 0.16% month-on-month (~2.0% annualised). This begs the question, has the impossible been achieved - has the Fed got rid of inflation while the economy improves?
Today’s post shows why this conclusion may be possible, yet improbable. It illustrates further how in a high government debt/GDP world, Quantitative Tightening (“QT”) is likely needed to truly kill inflation, yet the Fed and Treasury have actively worked on neutering that avenue. Thus, liquidity remains abundant, and a return of inflation seems likely late this year or next year, despite the high interest rates
As always, the post concludes with my current outlook on markets. I remain long US value, in particular US banks, energy and rails, as well as long China Tech and short Europe
To start, what are the signs that the US economic cycle is turning up?
The US labor market remains tight. More so, after some deterioration, recent trends are again improving. As mentioned in my last post, WARN notices which lead initial claims by ~2 months fell meaningfully in June. Further, the LinkedIn hiring rate, another employment lead, has ticked up recently after a long stretch of declines
Real earnings are up as nominal wage growth continues to track above inflation. Historically, real earnings increased at the onset of recessions as people wanted to save more. However, in this instance the improvement is likely driven by the decline of cyclical inflation components such as energy or used cars
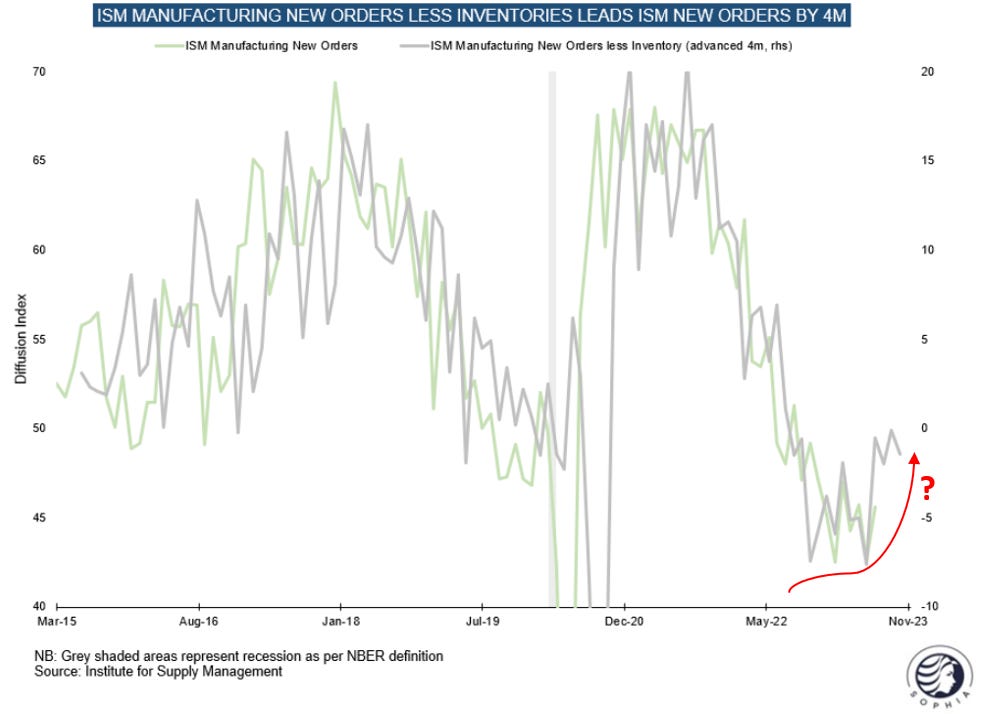
The ISM Inventory-New Orders ratio appears to turn. This measure has led production by ~3-4 months in the past. Its renewed upward slope implies that inventories are now more balanced. Similar datapoints such as the NFIB Small Business survey also showed some recent sequential improvement
All construction segments are back to growth. While public and commercial construction never slowed down due to the Inflation Reduction Act, residential construction has now also turned the corner. Regular readers will remember my emphasis of housing as “source” of the business cycle. After a year of negative GDP contribution, this will likely be growth supportive for the remainder of the year. More so, the backlog for commercial construction remains immense, as per the Dodge Institutional Planning Index
Now, with all the supposedly aggressive monetary policy, rates hikes from 0% to 5%+ and all the recession talk in its wake, how can the US cycle turn before there is a recession?
The reason is the very expansive role of the US government. In various previous posts I had highlighted how the role of US fiscal spend changed the cycle dynamics (e.g., “A Heretical Thought”, “Europe vs US”). Three aspects stand out:
The US budget deficit for 2023 lies at -8%, an astronomic number outside of crisis or war, and at a time when the unemployment rate is below 4% (!)
The Inflation Reduction Act pours billions of US dollars into commercial construction (see last post). This turns an industry that historically contracted under the weight of high interest rates and heavily shed employment into an economic growth engine, stabilising instead of unsettling the remainder of the economy
Hundreds of billions of interest is paid into the economy on the >100% government debt/GDP. This is probably the least focussed on dynamic of this cycle, but one of the most simple ones. Since government debt levels are extraordinarily high, with radically higher rates the interest paid on these also quickly jumps to economically meaningful levels. At a Fed Funds rate of 5.5% and 100% debt, interest paid by the government represents a huge economic subsidy to anyone holding Treasury bonds and bills, from asset managers to foreign governments to affluent individuals to anyone holding a deposit at a bank that can now pay higher rates. Corporates are an important group here, their immediately higher income on cash holdings has so far offset the delayed onset of higher debt cost
This very expansive role of government is the reason why I had frequently compared the current period as most similar to the post-WWII years, the only time in recent Western history where both inflation and government debt/GDP were very high
Regular readers may be familiar with the chart below, it shows an inflation yo-yo for the post WWII period
Back then, inflation was successfully tamed from very high levels, even though interest rates were capped at low levels (!) within Yield Curve Control. Afterwards, an inflation resurgence followed due to the Korea War
But how did the Fed do it at the time if rates were kept low? To be clear, I do not believe in the Modern Monetary Theory (MMT) paradigm that low interest rates solve inflation. Turkey has just shown that’s not the case. It was an altogether different tool that solved the post-WWII inflation: Quantitative Tightening (“QT”)
Just to recall, within QT the Fed either lets government debt it owns expire, or sells it outright. Its balance sheet shrinks, the private sector needs to come up for funding the government
Below chart shows the Fed’s balance sheet during the post WWII period - it was essentially cut in half

Why is QT so important in an economy that has 100%+ government debt/gdp? QT removes cash from the economy, it decreases the amount of money in circulation. In contrast, with high government debt/gdp, rates are much more push and pull. They decrease economic activity on one end by curtailing credit for the private sector, but stimulate on another by paying out huge interest payments
Ok, let’s assume QT is needed, isn’t the Fed doing that anyway? Here we get to a stunning revelation that has a lot to do with politics, and the fear of a financial crisis being much larger than the fear of inflation
It is true that since mid-’22 the Fed conducts $90bn of QT every month. The Fed’s balance sheet has declined in accordance, outside of an increase during the Silicon Valley bailout
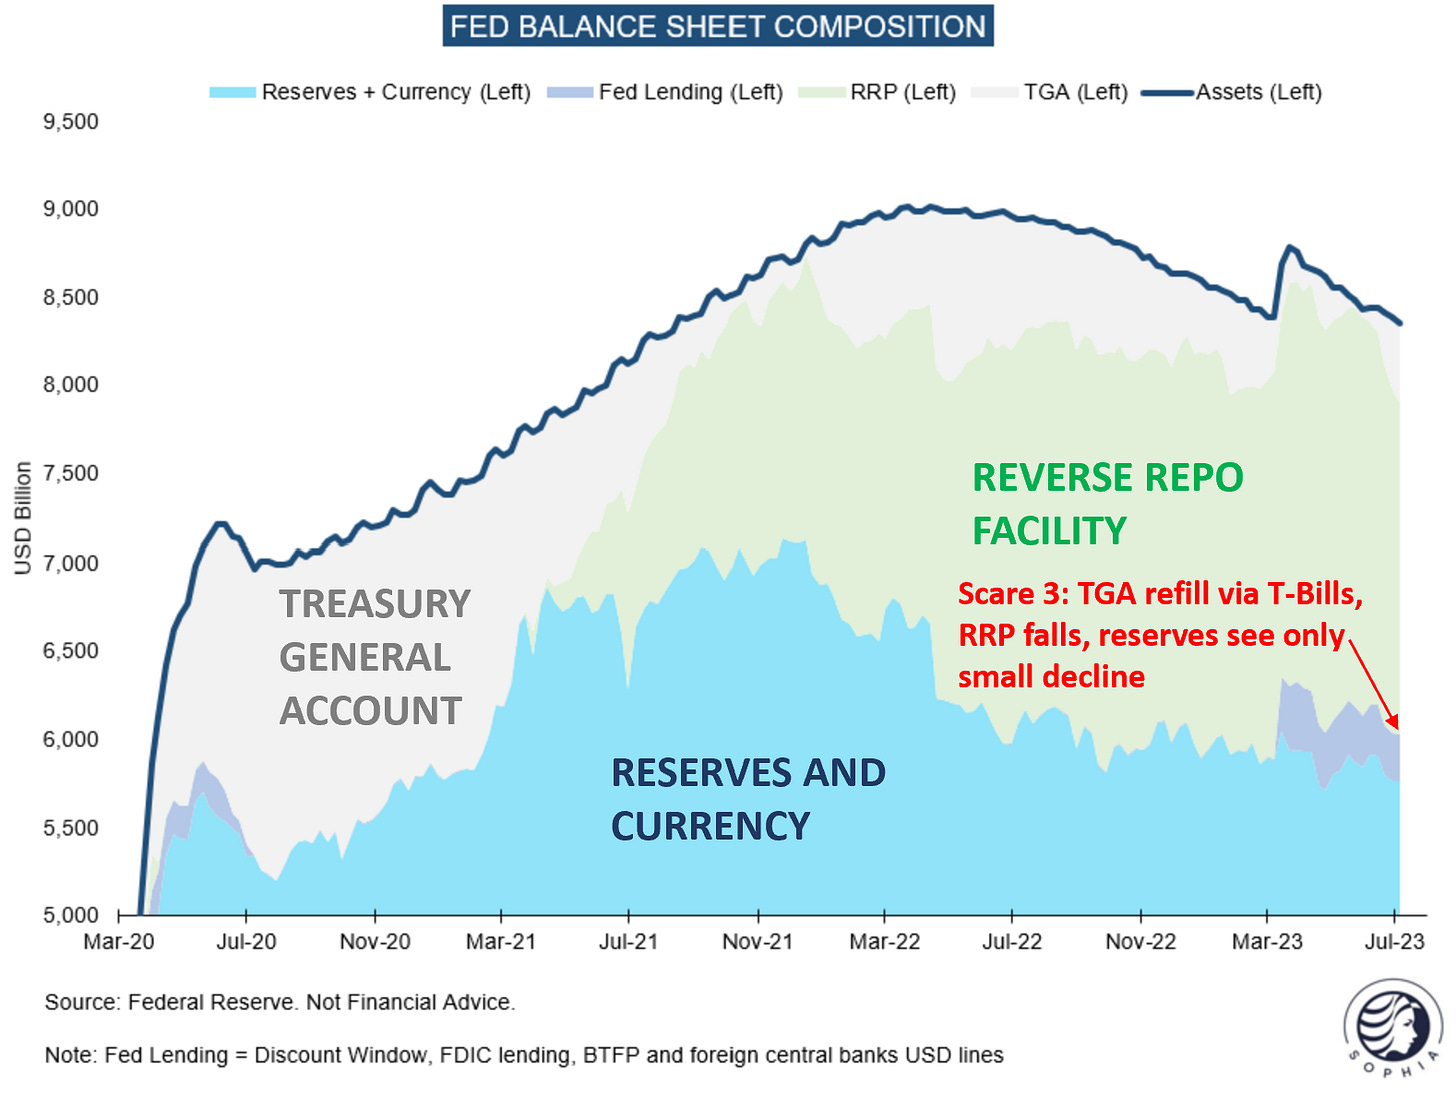
However, what truly matters for the economy is only a subcomponent of the Fed’s balance sheet - bank reserves, the blue shaded area in chart below (incl. static currency in circulation) Why? With their levered balance sheets, banks are the conduit to both asset market pricing and real economy lending.
Reserves are the cash banks leave at the Fed, if they decline, banks will sell other assets to maintain the reserve levels they are comfortable with. If they increase, banks can buy assets, extend credit etc.
The other two components are outside of this dynamic. The Reverse Repo Facility (green) is money market cash directly parked with the Fed. The government’s cash coffers, also known as Treasury General Account (grey), also sits outside the banking system
When we look at reserves, we notice they fell in line with the Fed’s balance sheet, when the inflation fight began. Since the Fall of ‘22 however, they took a different trajectory, sideways and then up again. So the transmission of QT into the real economy has been neutered since then Fall, but why?
The reason are three scares, where each time politics flinched and prioritised liquidity provision to banks over inflation. In particular:
First scare: In October ‘22, the stock market crashed, and Janet Yellen got publicly concerned about the US Treasury market’s soundness. In the UK, the pension crisis took place. From that moment on, reserves stopped declining as the US Treasury decided to spend down its $900bn coffers, which lasted until the resolution of the debt ceiling this past June. So while the Fed Balance sheet continued to contract, cash was moved out of the TGA at the same time, and Reserves stopped falling
Second scare: In March ‘23, Silicon Valley Bank went under. Several other US regional banks looked endangered and the common concern was a financial crisis would be at hand. The Fed introduced emergency lending facilities such as the BTFP, they were used by banks. In their aftermath reserves went up and asset markets rallied
Third scare: After the debt ceiling debate was resolved, the Treasury’s accounts had to be refilled (see first scare, TGA spent down from $900bn to near 0). A daunting $500bn had to be taken out of reserves over a short period of time, analysts expected this would crash the market. Again, the Treasury got scared - no one wants to be responsible for crashing the market. So it adjusted its issue schedule to increase the supply of bills preferred by Money Market Funds. As a result, the TGA refill did not come at the expense of reserves, it came at the expense of the RRP, which Money Market Funds exited to buy the newly issued bills
Why does all of this matter? Again, there is a case to be made, that in a high gov-debt to GDP world, interest rates don’t do much to fight inflation as the high rates pour funds back into the economy on one side, while taking them out on another side
Inflation has come down a lot, as I predicted. However, while nominal income still runs strong, this decline seems to be mainly owed to cyclical factors such as energy and used cars, while some long leads for rental growth (40% of CPI) already pointing up again
Keep in mind, energy costs permeate many other inflation categories indirectly. And in a classic example of reflexivity between markets and the economy, the oil price has been depressed this year by a near-record amount of shorting amidst ubiquitous recession expectations, providing a boost to consumer pockets. This makes it probable that oil increases again as these shorts get squeezed (why I continue to be long energy, see markets sections)

Conclusion:
In a high government debt/GDP economy, Quantitative Tightening appears a more effective tool to control inflation than interest rate hikes
Today’s loose financial conditions and buoyant markets, from equities to crypto, suggest that liquidity is still ample and could provide the fuel for a resurgence in inflation as the US cycle turns
There seems to be no political will to truly apply QT, as the fear of declining asset markets is greater than the fear of inflation
For those reasons, there is a significant risk that inflation returns late in ‘23 or over the course of ‘24
Where could I be wrong?
The cyclical upturn I see turns out to be a headfake - This remains a possibility, I see a reasonable amount of evidence as laid out, but no certainty
The lags of monetary policy are long and still to come - This also remains a possibility. Some effects of higher rates will indeed only be felt in ‘24 or ‘25 even as e.g., expiring corporate debt needs to be refinanced. The transmission to the housing market via the 30-yr rate, and to financial markets via tighter or wider risk premia is pretty much immediate
Inflation will abate even as the economy accelerates again - This is the Goldilocks scenario, which could take place entirely, or could be assumed to take place by markets until proven otherwise. A lot of things would have to go right for this to happen, but I won’t rule it out
What does this mean for markets?
The following section is for professional investors only. It reflects my own views in a strictly personal capacity and is shared with other likeminded investors for the exchange of views and informational purposes only. Please see the disclaimer at the bottom for more details and always note, I may be entirely wrong, may change my mind at any time and none of this is investment advice
US Banks and Energy (Oils and Oil Services) - As mentioned in my last post, I own these sectors as they are highly underowned and key beneficiaries of an early cycle recovery, whether real or just imagined by markets. I have also added US Rails on the long side, which share the cyclical aspect
Europe - I remain short Europe, mainly via equity indices, anticipating a divergence in regional economic outcomes, as introduced in last week’s post (Europe vs the US)
Tech - The AI hype looks to have peaked for now and any summer market consolidation may be lead by Tech. However, this story is likely not over and Tech could lead again to the upside later in the year end. For the near future, I continue to see leadership in the lagging cyclical areas of the market
China - I am bullish on and own China Tech. It is very underowned, so fits my contrarian view and given the deflationary dynamics in China’s economy, I believe more domestic stimulus to be likely
Bonds - I’ve been stopped out of Gilts very quickly as they went below their previous low (see here). I’ll look to revisit these another time
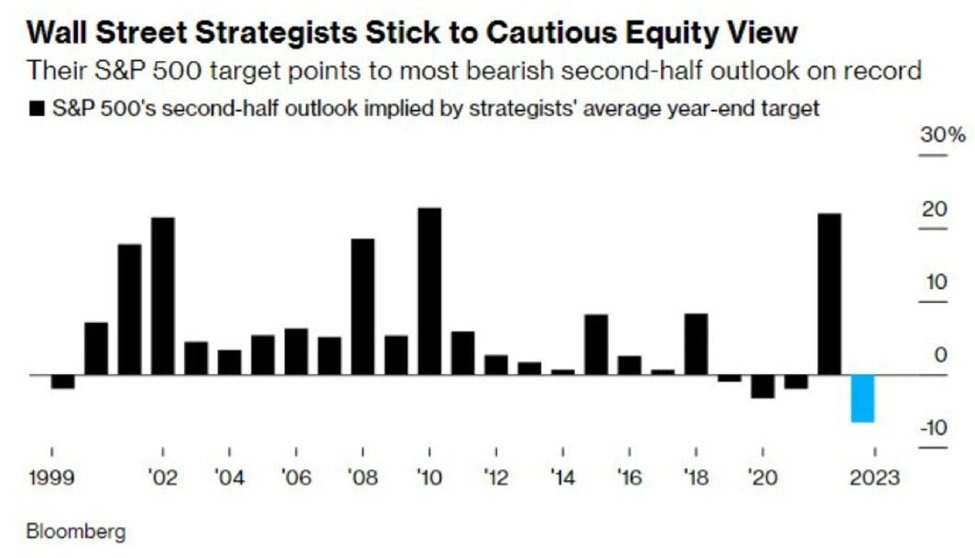
I am currently market neutral as we near the seasonally weaker period following July’s options expiry on the 21st. After that, a summer swoon would not be surprising, possibly culminating in a September or October sell-off that could be bought. More broadly, the persistent bearishness of Wall Street Strategists makes me think the year likely ends better than most still expect


The inverted yield curve is still causing a credit crunch in the private sector. The high government spending may support the economy for a while, but the economy cannot go forever without private investment.
I don’t disagree with your short term positioning, but I would be prepared to bail as soon as the credit market has another convulsion.
Thanks for the article!
Great piece as always! The Gilts and Bunds were tough to trade. I remember you had put 5y Treasuries on along with those - do you still hold these?