Black Dynamite
How Oil will unsettle the financial system of the past decade
In my last post “Tremors” I highlighted how US bond yields would likely continue their rise. Late last week, following another round of poor inflation data, the US 30-Year Treasury Bond hit 4%, a 11-year high. Regular readers will be familiar with my view that very high Western public and private debt cannot be reconciled with these levels of interest rates. Yet higher interest rates are likely necessary to tame inflation. As such, a dilemma between funding government deficits and fighting inflation eventually emerges, which likely forces the Fed to pause its aggressive policies
This pause was foreshadowed last week when Treasury Secretary Janet Yellen complained about “inadequate liquidity” in US Treasury bonds. In reality, “inadequate liquidity” is an euphemism for challenged solvency - the private sector has no interest in buying US Treasury bonds with Debt/GDP at 120% and deficits forecast at $1tr p.a. for years
Janet Yellen’s comments may be the prelude to the return of government-led liquidity to financial markets. This moves the role of oil once again into the spotlight. While the world economy is in distress, oil still trades at elevated levels. Consequently, prices would rally even further with any moderation in central bank policy, and with it further entrench inflation
This post walks through the reasoning for oil’s return as key strategic commodity. As always, it closes with a current outlook on markets
Following the post-Covid reopen, Western Economies first saw an unprecedented boom in economic activity
This was followed by an equally intense hangover in particular in manufacturing industries - a classic boom-bust cycle
As economic textbooks suggest, the boom lead to capacity expansion in many industries. And now, as demand falls and supply rises, prices for many goods fall
Take container shipping as an example
The post-Covid boom in goods lead to sky-high shipping rates. Assuming the boom would continue, shipping companies ordered a record number of ships to be built. In the future, this very likely leads to much lower shipping rates
However, oil looks very different
The chart below shows investments into new oil supply over time. There is no supply response to the 2021 economic boom at all! In fact, capex declined further from depressed levels

The reason is simple: With climate change looming large, a concerted effort by governments, large shareholders and corporations was made, in good faith, to curtail oil supply, in order to reduce CO2 emissions
These policies are commonly summarised as ESG and continue to this day. Only last week, the world’s largest reinsurer, MunichRe, said it will no longer insure oil and gas projects

With policies like these, it is no surprise that investments into new oil supply stall. The issue is, it is much harder to reduce demand
Lower oil demand requires behavioral changes, from driving less to flying less to consuming less. Few in the Western world are willing to pursue that
It also requires restraint from an emerging middle class in Developing Markets that aspires to live the same lives as their Western counterparts
So while supply was curtailed, oil demand continues to grow
With strong demand and weak supply, the oil price decoupled from proxies such as the Global Manufacturing Purchasing Manager Index, which is in deep recessionary territory and would suggest much lower oil prices
What is more concerning, the Oil price would be even higher if not for two dynamics that keep it artificially low
First: China’s Zero-Covid policies
With the arrival of more contagious Omicron, China’s population had to endure a seemingly never-ending series of local lockdowns, which weighed on economic activity
Below chart with domestic flight movements shows the on-off nature of these lockdowns. It also shows how far activity levels are from previous years - flights are at ~66% below 2019
As a result, China crude oil demand is c. 1-2 million barrels/day (mb/d) below trend. A meaningful number, considering that the ~100mb/d global oil market only needs small demand/supply movements for considerable swings in price
The path to a reopened China remains highly uncertain. Some sources indicate Q1 ‘23 as likely end-date. Either way, at some point the country will reopen, local activity will rise and with it China’s demand for oil
Second: The US daily release from its Strategic Petroleum Reserve
Every day, the US releases ~1mb/d from its Strategic Petroleum Reserve, which is held in underground storage in Texas in Louisiana and was built up in 1975 in response to the 1973/74 oil embargo. It is an emergency stock to ensure the US economy and military keeps going in case of war or other calamities
As the chart below shows, the pace of depletion is not sustainable. In little over a year these reserves would be empty. The release is currently scheduled to end after the midterm-elections in November, with another 10-15m barrels left to be released
Summary: The oil price is high for the current stage of the economic cycle. However, should China’s zero-Covid and the US SPR release end, it would move the Oil demand/supply balance by a significant ~2-3mb/d, with much higher prices likely
More so, as Oil becomes scarce again, the power it provides to those with abundant supply grows
Every government loves power, and no government likes being ostracised. So an unholy alliance has formed between the two international outcasts Saudi Arabia and Russia as the key axis within OPEC+, the association of oil producing countries that controls ~30% of global oil production
Two weeks ago, OPEC+ cut its production by 2mb/d, a significant reduction at a time of elevated oil prices. It was a move that infuriated the US, Saudi-Arabia’s supposed long-time ally

But it is not only geopolitics, production dynamics also likely tighten oil supply going forward
In light of Western sanctions, Russia’s production is forecast to decline by ~0.5-1mb/d in 2023
US oil production growth has been revised down multiple times this year. Staff shortages, an uncertain economic outlook and a higher cost of capital following the Fed’s interest rate increases all weigh on future production targets. Taking all regions into account, globally, a production decline of 1mb/d for 2023 seems realistic
With a longer term view, if we summarise the decline in production until 2030, and match it with offsetting expansion projects, the supply gap grows to a stunning 15mb/d+

Let’s add everything up:
An eventual China reopen, an end to the US SPR release and ‘23 production declines equal an incremental supply demand imbalance of ~3-4mb/d in 2023, while OPEC+ seems unwilling to create more supply
This is a tremendous deficit for an inelastic commodity, and would suggest much higher oil prices for 2023
BUT - there is still an elephant in the room: Global demand
For all we know, we are headed into a deep global slowdown next year, with the US Consumer the one healthy island in an overlevered world economy
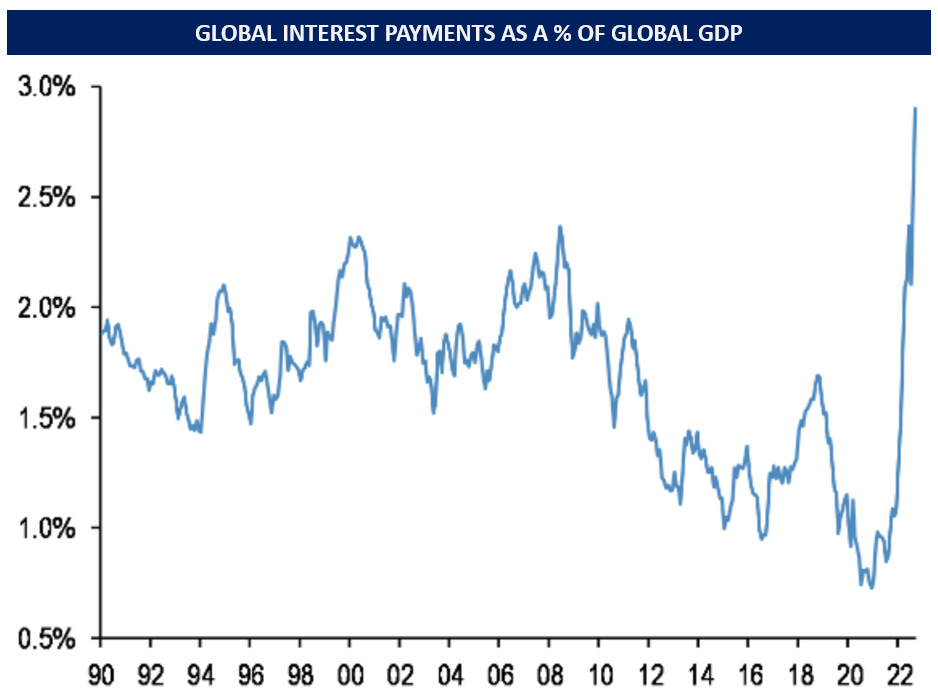
Looking at the chart below, global interest payments have shot up at an unprecedent pace. This higher cost of capital feeds through to slower economic activity with a ~12-months lag. It suggests a deep global downturn that lasts well into late 2023

The inelasticity of oil works both ways. A small reduction in supply can push prices much higher, a small reduction in demand can make oil prices tumble
In 2008, when the world entered a deep recession - in that case led by the US consumer - global oil demand cratered and the oil price collapsed from a high at 145 $/bbl to below 50 $/bbl. In Q4, oil demand declined by ~4mb/d
However, 2008 did not see any of today’s dynamics that suppress demand (i.e. China’s zero-Covid/SPR). More so, back then, high prices induced a strong supply response
For those reasons, it seems unlikely that oil prices decline to a similar extent this time around
Conclusion:
For the next 6-12 months, a slowing global economy likely weighs on oil demand. This slowdown might balance or outweigh the price boost from an end of the SPR release or China’s zero-Covid policies
Beyond that timeframe, the lack of supply becomes more pertinent, and an eventual cyclical recovery of the world economy will meet an even worse oil supply picture than today
Strategic options such as the SPR release will be gone by then. What likely follows are much higher oil prices, and with it higher inflation.
Thus, in addition to structurally tighter labor markets, deglobalisation and lower immigration, oil will be a key reason for the demise of the financial system of the 2010s, which was shaped by low inflation and low interest rates
With this in mind, should the Fed provide liquidity to markets once again, oil seems the likely recipient of these new funds
So the key question is - When will the Fed be forced to change course and alter or abandon its aggressive monetary tightening?
I think the chances are high that the moment comes soon. Why?
Credit markets are de-facto frozen. US High Yield issuance is at its lowest since the financial crisis. Keep in mind, many companies need open credit markets to re-finance existing debt
More so, it will get worse. Credit spreads are driven by liquidity and fundamentals. Both likely deteriorate from here, as the Fed continues with QT and the economy slows. At the current pace, bankruptcies will soon go be commonplace

In a highly levered world, a credit freeze quickly cascades into a systemic crisis as market participants scramble for liquidity. The UK pension crisis provided a preview. This liquidity crunch not only affects the private sector, it also extends to sovereign debt
As alluded to in the introduction, US Treasury bond yields keep rising as there is insufficient private sector demand for long-term obligations of a highly levered country with $1tr+ deficits forecast for the foreseeable future
With Quantitative Tightening, the Fed reduced its role as buyer of last resort. Foreign buyers are hamstrung by weaker domestic currencies, which are caused by foreign Central Banks running comparatively dovish monetary policy. Please see more details in previous posts e.g. “Quantitative Frightening”
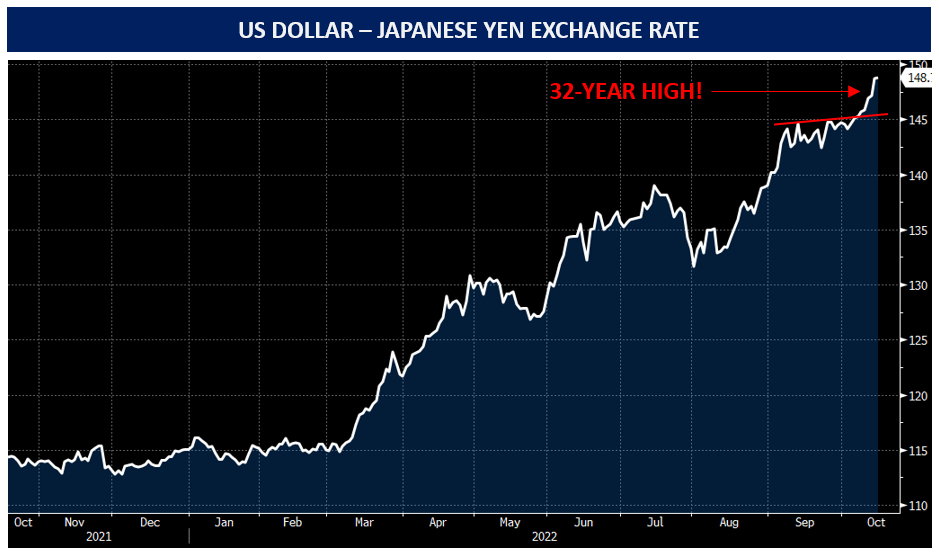
The Japanese Yen is the ground zero for these dynamics, it just broke out to 32-year highs
These negative feedback loops will run until the Fed intervenes, until then it likely is one-way street UP for US bond-yields. Unchecked, we’d face a direct line into mass sovereign and private sector defaults
This is unlikely to happen - the social consequences would be unbearable. Janet Yellen has taken notice of the storm brewing, and in my view her comments are the beginning of the end of the Fed’s uber-hawkish stance

In “Quantitative Frightening”, I outlined various ways how the Fed could provide liquidity to financial markets again
Janet Yellen alluded to one of them, allowing big US banks to hold more US Treasuries. This so called SLR reform was also recently mentioned by Fed Governor Michelle Bower (see full speech here). For obvious reasons, banks are heavily lobbying for this (it would boost their profitability)
Treasury buybacks have also been floated, with the Treasury currently asking primary dealers their view on execution. In this option, the Treasury buys back the currently “illiquid” long-term bonds and thereby lowers their yield. It funds these purchases by issuing short-term bills. Money Market Funds buy these bills with funds currently parked in the Reverse Repo facility. That way, RRP funds are also brought back into circulation
Summary: Current monetary policy is unsustainable, as it will lead to a financial markets meltdown. The outline of the course correction appears visible now, likely to be implemented over the coming 1-2 quarters
Importantly, the market remembers Fed liquidity intervention as a big bang akin to March 2020, when the Fed printed Trillions of US Dollars. This is highly unlikely. Much more likely seems a series of start-stop measures, where some liquidity is provided, financial conditions ease while inflation is still high, and attempts are made to unwind this again
Start-stop interventions, higher bond yields, higher commodity prices, tighter labor markets and deglobalisation all have one aspect in common for the economy and financial markets - much higher volatility. They also create new winners and losers, which are essentially the flipside of the last decades. This is how I see them:
Winners:
Young people - Most of their wealth is generated from wages, which are bound to benefit in tight labor markets. They also typically carry more debt, which devalues in a high inflation world
Debtors - High inflation and with it high nominal growth erodes static nominal debt. Large debtors include most Western governments
Workers - The demographic cliff and deglobalisation lead to tight Western labor markets, therefore workers will take a higher share of corporate revenues
Traders - High volatility benefits traders of all sorts, from investment banks to commodity houses to experienced individuals
Commodities - These are cyclical and will move up and down with the economic cycle, but through the cycle likely see higher prices in a high inflation world
Industrials - These will benefit from higher capital expenditure related to reshoring, and higher Western purchasing power due to deglobalisation
Banks - Higher interest rates mean higher net income, in particular for European banks out of a negative interest rate world
Losers:
Older people - The inverse to young people, asset-rich and carry low debt
Savers - Even though current US real yields are significantly positive, eventually they will have to revert to negative territory or the public in private debt load crashes down on us. From that moment, savers’ fortunes are at a disadvantage
Company Management - Low interest rates favored buybacks and other means of boosting EPS, which determines management compensation. Further, equity grants benefited from high market multiples. This likely reverses
Asset managers - A high inflation world makes leverage expensive and weighs on asset prices. Both are a negative for asset managers
Growth stocks - High interest rates lower the valuation of long-duration assets. Against this works the undeniable trend of faster adoption of break-through concepts
For investment management in particular, we are looking at an industry shaped by 40 years of ever lower interest rates and low volatility. The “Fed Put” made timing irrelevant, the market always went up. Shifting to a high-inflation, high-volatility regime requires a different skill set, one where timing is everything
What does this mean for markets?
As always, below is my personal attempt at connecting-the-dots for my own investments. Please keep in mind - I may be totally wrong, nothing is more important than risk management, and none of this is investment advice
Cash - I can only repeat like a Tibetan prayer mill, 1-year US Treasury bills yield ~4%. Cash held for asset purchase purposes is not eroded by consumer price inflation, only by asset price inflation, and we see asset price deflation right now. I have most of my cash invested in 1-year T-Bills
Equities - As stated in previous posts, positioning is extremely one-sided, which makes equities prone to violent counter-trend rallies. Being short is dangerous. Therefore, I am expressing my fundamental views via US Treasury Bond shorts (20 Year+, TLT) given much cleaner positioning there, and left any equity short exposure to a small Russell-2000 put and a small Avis short (see below). Should the market rally while bond yields stay high, I will re-enter in size
Avis - It is also a good illustration how the macro analysis is much more important than fundamental analysis, something I highlighted before in “It’s All One Big Trade”. This car rental company benefited from the auto shortage and corresponding high rental rates. But Avis also has 11.5x Net Debt/EBITDA ‘23E, so it lives and dies by US Treasury bond yields which dictate their cost of debt. I have a small short in AVIS in the belief that interest rates will stay high for longer
Bonds - A short of the long end of US Treasuries (20 Year+, TLT) remains my biggest position, see here from early October. This continues to seem the obvious trade to me. With the Fed conducting QT and foreign Central banks too dovish, the two main buyers (Fed + foreigners) are out of the market and the private sector is unwilling to pick up the tab
Oil/Commodities - As long as QT goes on, these will be challenged as liquidity is withdrawn from all global assets. But the day the BOE ended its QT program provided a mini-preview of what will happen in an eventual Fed pause - oil and commodities rallied that day. I am looking to buy these when I believe a Fed U-Turn imminent, e.g. via SLR reform or Buybacks
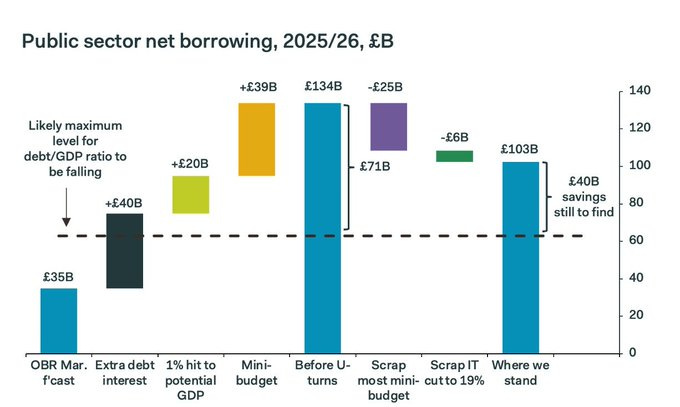
UK - New chancellor Jeremy Hunt’s reversal of Trussonomics was a big step in the right direction. However, his task of breaking the downward spiral in Gilts likely remains impossible. Why? £40bn+ savings are necessary to balance the '25 budget (see chart below). These can come from tax hikes or social service cuts. Tax hikes are bad for growth (= GDP goes down more). Social service cuts seems impossible to me, with e.g. NHS wait times 2x as high as 2018 (!)). The likely endgame remains Yield Curve Control by the BOE, likely introduced after more economic stress

For this and other analysis, my team and I track hundreds of datapoints about the state of the economy and liquidity. We now share these freely, in the spirit of open-source, in their own dedicated channel on Twitter (SophiaKnowledge)
I hope you enjoyed today’s Next Economy post. If you do, please share it, it would make my day!


Treasury Buybacks likely to be maturity matched. Is there any specifics around them being funded by bill issuance?