Is Inflation Over? (Pt. 2)
A brief review of this week's inflation data
In August I wrote a post called “Is Inflation Over?” after US Consumer Price inflation had declined. At the time, my answer was a firm no. Following this week’s US Consumer Price inflation data, we are tempted to ask the same question again. The CPI came in weak and in parts deflationary, something I had pointed out as likely in “A Frugal Christmas?”, so, is it over now?
The answer might be, yes, for a while. I will explain the reasoning and potential consequences in today’s post, which, as always, closes with a current outlook on markets
To start, let’s first review this week’s US inflation release
The CPI year-on-year print came in at 7.1%. This is still very high, but a backward looking statistic
We want to know what inflation currently does, for this we need to look at its evolution month-on-month - the headline number only went up 0.1%. Core CPI, which excludes volatile categories, went up 0.2% (or ~2.5% annualised)

Let’s look at some more details:
Goods prices turned firmly deflationary. Whether it is used cars or electronics, prices for “stuff” are dropping
A downtrend in Services is also visible, even if much less pronounced

Services include rent, which the Bureau of Labor Statistics measures with a ~1 year lag, as expiring rents are only gradually renewed
Using today’s rents instead, Core CPI turned in fact negative!

The sole area that continues to show inflationary pressure is a narrow measure of “labor intensive Core Services” which excludes rents, transport and medical services and leaves items like haircuts, restaurants or childcare. It accounts for ~25% of CPI
This begs the question, why is inflation coming down so quickly? In my view, it is quite straightforward
The reason is because consumer demand has weakened substantially since the Fall. Many datapoints show this, as outlined in “A Frugal Christmas”
Below another example: Johnson Redbook tracks weekly sales for 9,000 physical retails stores across the US. The two weeks post Black Friday saw a much steeper drop, followed by a much weaker bounce in comparison to past years
So why did consumer demand weaken, it appeared to be strong for most of the year? The reason is two-fold:
First: People are funding their current spending out of savings, and savings are running out
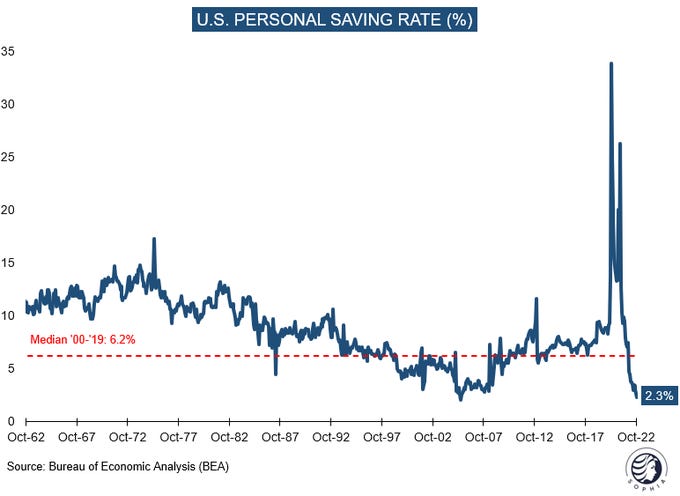
The US personal savings rate is at historical lows, a likely unsustainable state
Why is it is so low? Because people spend their existing savings…
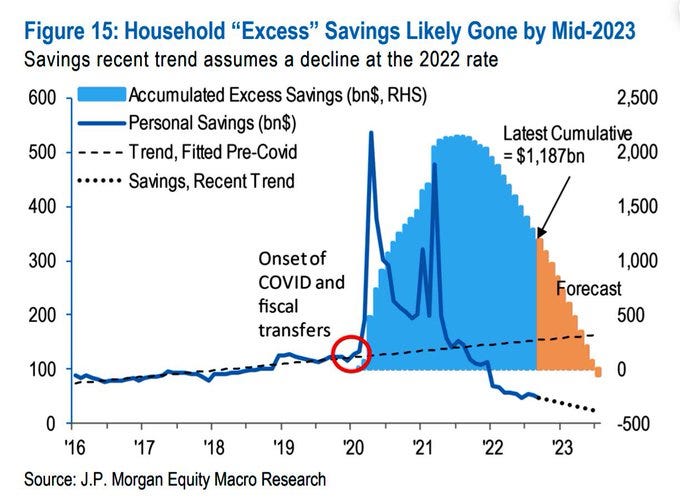
…which, at the current pace, are gone by Q2/Q3 ‘23. Now, that is still many months away, but this process is not symmetrical for all income groups
In fact, it is a staged process, with the lowest income quintile already run out of savings, and a critical mass (~50%) of US consumers likely out of excess savings by Q1, with many adjusting their spending in advance. In a socially upsetting way, the highest quintile might never run out, as their salaries more than cover expenses - yes, inflation always screws the poor
Second: Tight monetary policy
In the past, inflation would spin out of control as households and corporates take out credit in anticipation of more inflation. This newly created money would then fuel more inflation
The Fed’s aggressive monetary policy undercut this process. Credit has become too expensive, QT and the RRP drain deposits. As a result, M2 money supply is down this year, a historical anomaly
This means the depleted savings are not replenished by another source. One might indeed ask, where do the spent savings end up? They go to Europe and China to pay for goods manufactured abroad, and to the Treasury whose deficit this year is much smaller than in ‘21
Summary: As more US consumers run out of savings, inflation prints are likely to come down further
Ok so that’s it, inflation is done? Yes, it is likely done for the foreseeable future, at least for the next 6 months
But what about the tight labor market? What about wage growth? What about deglobalisation, demographics and lower immigration?
Yes, all these continue to matter. They will matter for the medium term. Inflation likely comes back in late 2023. Let me explain why with two charts - the distinction between Goods and Services is very important here
First, the inflation cycle for the Goods economy
So we know that households are spending more than their wages can afford. They finance this with savings
We also know that corporates assumed this bullish demand would go on forever, so they increased production and now sit on immense inventories
Demand drops as savings run out. Also, demand has been pulled forward (how often do you need a new TV?). This coincides with producers’ high inventories, so prices are aggressively cut to clear these. We see this in the Goods CPI data above
Once that process is over, wage growth and goods price inflation should align again
Deglobalisation, demographics and lower immigration are all reasons for high wage growth going forward
First, the inflation cycle for the Services economy
For Services, it equally applies that spending was funded with savings. There is likely also some pull-forward demand (“revenge travel” post-Covid)
However, inventory dynamics don’t really apply to services. As such, after a demand decline, some period of price stagnation rather than price declines seems more plausible. I would expect the Core Services CPI to show such a pattern over the next 6 months
Now, these are simplified illustrations. Two very important dynamics need to be mentioned in addition
First: Debt
A deflationary bust evolves from a trivial cycle into a big crisis once debt is involved. During the boom, confidence is high, which leads to more debt issued. Asset valuations increase, which creates the illusion of higher collateral value against which debt is issued. Both dynamics revert in a bust, but the nominal debt levels remain
Please see my recent piece “Incentives and Inequality” on how Quantitative Easing led to a global debt frenzy, as Central Bank buying encouraged the issuance of more debt, with high risks especially in levered loans

Given the enormous global debt load and the risk that creates in a deflationary bust, I find it very likely that the Fed will restart QE or something similar in 2023, possibly forced by a large credit default event (Credit Suisse? China?). This then likely exacerbates medium-term inflation
Second: Unemployment
The charts above assume a period of stable wages during the Bust/Stagnation phase. This would require a limited increase in unemployment. Historically, unemployment has shot up in recessions, so aggregate wages actually fell, which then prolonged the slowdown
I’ve laid out the reasons before for why this time around unemployment might not increase as much (see Capital vs Labor Pt. 2), with a record ratio of vacancies to unemployed central to this thesis

However, I do hear of corporate layoffs in the making. Any calls on the evolution of unemployment are highly speculative given the unprecedented context. Some unexpected permutations are possible: Unemployment could go up while vacancies remain high, as skills of laid-off workers do not match those sought in vacancies (this happened in the early 2000s in Germany). Or today’s vacancy data might be inflated
On the other hand, wage growth might continue while unemployment increases as certain sectors cannot find workers. Or unemployment stays low, but wage growth also slows down as corporate profits are squeezed
Either way, given demographics, deglobalisation and lower immigration, a structurally tighter labor market seems highly likely over the medium term
With this in mind, it seems unsurprising that at yesterday’s FOMC conference, Powell indirectly opened the door to a higher long-term inflation target
Putting the pieces together, my conclusion for today’s post:
Inflation is likely done for the next 6 months, as US consumer savings run out and especially Goods deflation accelerates
A deflationary bust in Goods and stagnation in Services likely create a severe challenge for the world economy. Given the global debt load, it is likely that credit events eventually force Central Banks to return to the printing press
Looking further out, over the medium term, it seems likely that labor markets remain tight and wage growth high. As such inflation should return later in 2023, and structurally higher inflation seems likely over the next 5-10 years
After a decade of QE, followed by high inflation, both on the back of lower-income groups, there will be little political tolerance for a period of high unemployment, which would again hit lower income groups the most
As such, the bar for Central Bank intervention is likely lower than what is commonly assumed
What does this mean for markets?
As always, below is my personal attempt at connecting-the-dots for my own investments. Please keep in mind - I may be totally wrong, nothing is more important than risk management, and none of this is investment advice
As discussed in recent posts, my central scenario remains that of a “hard landing”, which would be bad for risk assets, as long as the Fed remains hawkish (i.e. does not intervene to support markets). Yesterday’s FOMC meeting has not given any reason to believe the Fed would change its hawkish stance soon
As such I continue to remain short risk assets, with a particular focus on Cyclicals. These include Materials (SXPP), where I believe with 20% vacancy rates a further inflation of the Chinese property bubble seems unlikely, thought this is what the market prices. Further, Europe (DAX) as well as US Industrials (INDU) and US Regional Banks (KRE) which suffer from deposits outflows in light of 4%+ money market rates, and where credit losses should pile up in the coming months
While there was a chance for a “Santa Rally” in case of a more lenient Fed, for which reason I had reduced exposure into the meeting, this seems less likely now. Either way, important catalysts to the downside are under way, with important economic releases early January (e.g. ISM Manufacturing PMI on January 4th) as well as pre-announcements for a likely weak Q4 earnings season, also from then onwards
In my view, the big picture remains simple:
As outlined in today’s post, we likely enter a period of weak demand, as consumer savings run out
Following 14 years of QE and immense excesses over Covid-19, there is a record amount of debt, especially government and corporate
Historically, at this stage in the cycle, the Fed either cut rates or started QE. Right now, it is still raising rates and conducting QT
After a strong rally, especially equities are extended and valuations very high
In my view, this is a bad context for risk assets. There will likely be more credit events and defaults, and with it likely more forced asset selling, as we have just seen with Elon Musk’s huge Tesla placement. It is likely prudent to stay cautious, with an emphasis on USD cash that currently pays 4.3% interest, to then have the dry powder to go all-in when the bear markets nears its end, which in my view will be in the first half of 2023
I hope you enjoyed today’s Next Economy post. If you do, please share it, it would make my day!


amazing work
Incredible work, man. On time and spot on, as always. Thanks for the work put on.