A Frugal Christmas?
The US Consumer is slowing more than expected. Important implications follow
The US consumer represents 70% of US GDP and is the engine of the world economy. Resilient so far with pandemic stimulus savings, it now shows serious signs of slowing, just as we enter the holiday season. The US consumer is the one block that holds the global economic Jenga tower together. Should it “crack,” we will be in for a rough ride. This post walks through recent data and lays out the implications, including for inflation
As always, the post closes with an outlook on markets. With the carnage in hedge fund positioning now past us and economic data probably worsening from here, I believe this rally likely to be over. Accordingly, I’ve transitioned from a long stance back to short risk assets (see here)
Today, a myriad of datapoints allow us a real-time look at the state of the US consumer
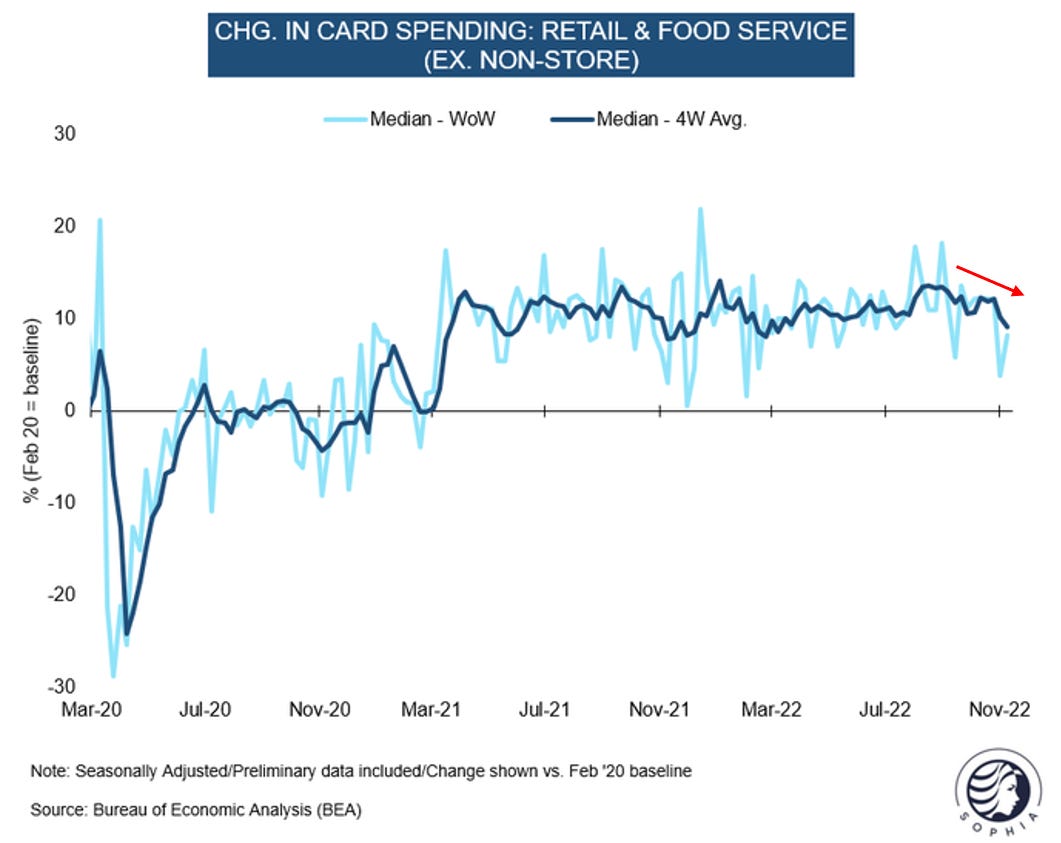
Let’s start with credit card data published by the Bureau of Economic Analysis, and collected by Fiserv, one of the largest card intermediaries. We see a meaningful drop-off in spending over the first weeks of November
Now, this is just one datapoint, so before concluding anything, we’d want to corroborate this from other angles. For this, let’s look at some data published by big banks, who aggregate information across millions of customer accounts. Below a snapshot from Bank of America’s November Consumer Checkpoint report. Again, we see spending tail off recently
More so, in the same report, Bank of America also asks its customers their spending intention for the holiday season. Roughly half want to cut back at least “a little”, or “significantly”
Looking further, we can crosscheck signs of a recent slowdown with data by credit card provider Mastercard. Again, the findings are consistent and October shows a slowdown

The Mastercard data highlights another important dynamic. Growth numbers appear impressive in nominal terms, but once you deduct inflation, growth is much more aenemic (nominal = incl. inflation, real = excl. inflation)
But who has their ear closer to the ground than the top 4 US retailers Walmart, Target, Home Depot and Lowe’s, whose import volume is more than the next 24 companies together combined
Conveniently, they all released earnings last week - their financial year starts in February, so their 3rd quarter ends on 31st October
Let’s look at Target first
The company confirms what the data tells us. Spending softened late in the quarter, and that trend continued early November. The market did not like Target’s results, the stock was down 12% on the day
Walmart on the other hand beat and raised expectations
The stock was up 7%, and Walmart is the US’ biggest retailer, so does that invalidate our conclusions? No - Walmart benefitted from two dynamics: (1) affluent demographics traded down to save. And (2), Walmart sells a lot more food than Target. That category continues to do very well - people have to eat! And just as Target, Walmart sees softness in general merchandise
I had mentioned above the difference between nominal and real growth. When Walmart or Target talk about growth, they refer to nominal numbers. Real growth can also be thought of as unit growth (assuming unit mix stays the same). Interestingly, Home Depot points out that their units sold are now in decline
Summary: Looking at real-time data as well as commentary from retailers covering a large share of the US consumer wallet, a slowdown appears in progress that started gaining steam in November
Ok, so the US consumer is slowing. It's been strong for so long, so what’s changed?
I suspect two dynamics are at work here:
First - While there are still ~$1tr+ in excess savings in consumer wallets, these are unevenly distributed
As laid out in previous posts, the lowest income quartile already consumed its excess savings. I suspect this is now creeping up the ranks, with a higher share of Americans depleted of savings. It could also be that in uncertain times Americans simply want to hold more savings than before
But while savings are run down, prices for everything remain high. As a result, the number of Americans living paycheck to paycheck is now significantly higher than pre-pandemic. Below BofA data assesses this dynamic by comparing monthly checking account inflows and outflows

Second - The persistent shortage in new cars and corresponding higher car prices diverts a much higher income share to that category
America is a driver’s country, you cannot get around by other means. As such, aside from food and rent, one’s car is an essential item. If automotive costs go up due to scarcity and/or higher financing rates, that takes away from other expenditure

Summary: Gradually depleted savings especially for lower-income groups, high inflation and high automotive cost likely all contribute to the recent US consumer slowdown
Ok, so the US consumer likely slows from here, and with it the US economy. When can we expect it to turn up again?
The economic cycle is lead by housing and consumer durables. I discussed the role of housing in various previous posts, so today’s focus is on consumer durables
For these, inventory dynamics are the key driver. Coming into the year, retailers’ demand forecasts were based on elevated pandemic trends. Consumer behavior shifted down and to services, so inventories grew as retailers owned too much and of the wrong products. In Q1, Walmart held 32% more inventory than the year before
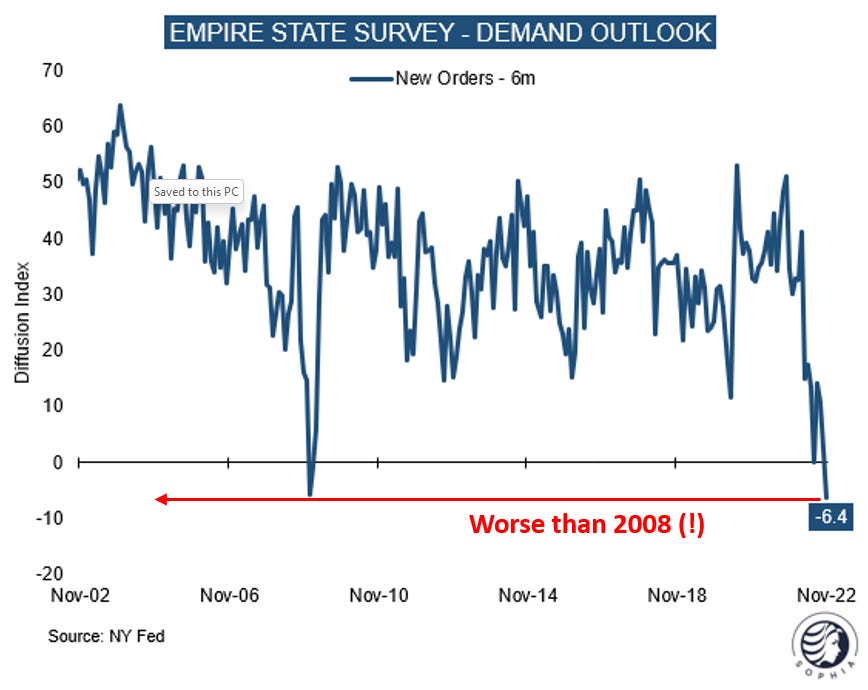
Accordingly, new orders for manufacturing businesses imploded. Full inventories = no need for new products on retailers’ shelves. See below survey of manufacturing businesses in New York state - it’s tracking worse than during the financial crisis
However, using the four big retailers as proxy, some excess inventory has been cleared. Walmart now quotes +13% year-on-year inventory growth, down from said 32% earlier
Working off the remaining inventory in a normalised demand environment would point us to a pick-up in industrial production in Q2 2023. This would also mark the beginning of the economic upturn
However, if US consumer demand softens, fewer units will be needed. Thus, the timing for a trough in manufacturing moves back
Summary: The trough in consumer durables production seems likely to occur in Q3 2023. Historically, financial markets turned ~1 quarter before
What does this mean for inflation?
Should the thesis of a slowing US consumer find confirmation, inflation might slow meaningfully over the next half year. In particular, I would expect many goods prices to turn deflationary
Now, 75% of inflation is driven by services, with labor the most important input cost. As laid out in several previous posts (e.g. “A Historic Agreement”), the labor market likely continues to show surprising resilience
Nevertheless, even then I expect wage growth to moderate from here until the likely upturn in Q3 ‘23. I base this on a common sense assumption: If the economy is bad, workers might be more hesitant to ask for raises, knowing that corporate sales are not going well. Their leverage might - temporarily - mostly be expressed in keeping their job amidst pronounced earnings declines
Together with lower goods prices, inflation prints in Q1 ‘23 might surprise to the downside. This could create a sense of the end of inflation. I would think of this as a “trap”, for the following reasons:
First - I would expect wage growth and with it inflation to pick up again quickly as the economic cycle turns up
Second - The timing would also correlate with a fully reopened Chinese economy around Q2 ‘23 and this significant incremental Chinese demand, an event to be expected after warmer Spring weather and broader vaccine distribution see local Covid-19 cases recede
Looking past the next six months, the reasons for structurally higher inflation remain firmly in place
What does this mean for markets?
As always, below is my personal attempt at connecting-the-dots for my own investments. Please keep in mind - I may be totally wrong, nothing is more important than risk management, and none of this is investment advice
Once again, I would like to split this section into two parts. A long-term view that looks out onto the next 5-10 years. Further, a short-term trading view that is driven the desire to avoid mark-to-market losses and to capture market swings
Long-term view:
The likely secular winners over a 5-10 year horizon are, in my view, Energy (XLE), Healthcare (XLV), Alternative Energy (TAN), Commodities (XME), especially related to clean energy transition (Lithium, Copper), Biotech (XBI) Banks (XLF), Royalty Businesses (e.g., in pharma, ERP in Software) and Gold
This view is predominantly shaped by long-term capital allocation dynamics (i.e. the undersupply of capital in many of the stated sectors and the past oversupply of capital elsewhere), secular trends and government finance dynamics that encourage high-inflation policies over austerity or budget discipline. Please see “Is Inflation Good?” for more details
Many of these are sectors are highly cyclical, and as laid out in this post we might now enter the more intense stages of a cyclical downturn. As such, timing does matter. In my view, the ideal moment to deploy capital in these areas for the long run is likely during 1H ‘23, near the trough of the economic cycle. Until then, cash or T-Bills seem a better alternative, as long as US Dollar real yields remain positive (currently ~1.5% across the curve)
Trading view:
The US Consumer is the pin that holds the cracking world economy together. If it goes, downside will be huge. I’ve mentioned in the introduction that I moved from long to short risk assets once again. Four reasons:
First - As per today’s post, I expect economic data to worsen from here, and the market’s focus to shift from inflation to corporate earnings
Second - Coincidentally, with the rally, market positioning has become less one sided. I discussed in previous posts how the current equity rally was driven by wrongly positioned hedge funds who all got bearish at the lows (“Shorting the hole”). The rally forced them to cover shorts en masse and reduce risk across their books (“degrossing”). The extend of degrossing has been extreme, as per chart below, and positioning is now much less one-sided
Third - I notice with concern that US Treasury bond market volatility picked up again, from still very elevated levels. Regular readers will be familiar with my view that the US bond market is the “mother of all risk assets”. I therefore find it likely that this pickup in volatility soon translates into other markets including equities
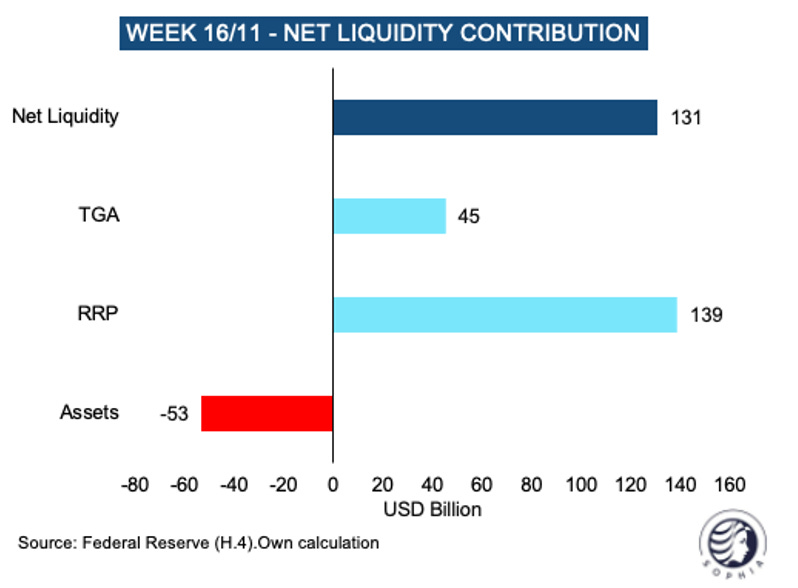
Fourth - There are some further unnerving signs of liquidity trouble brewing once again, such as last week’s $139bn draw from the Reverse Repo facility. This points to urgent liquidity needs somewhere in the financial system, potentially linked to the FTX implosion (see last post “Crypto Carnage”)
With this context in mind, I’ve sold all long positions aside from a small holding in China Tech (KWEB) and added to shorts in risk assets. Some more commentary on this:
Cyclicals - My focus in shorts is on cyclical sectors. From here, the market’s focus likely moves away from inflation towards corporate earnings. Cyclicals are likely to show much EPS weakness, as higher cost of capital, higher labor cost and slowing sales squeeze their margins
Nasdaq - Large cap Tech was long thought of as secular growth, however today has assumed cyclical characteristics, just think of Google Ads
Weak balance sheet - Levered companies will face a tough time once earnings turn, as the Fed likely reacts much later to the slowdown out of inflation fears
Energy - As mentioned, it remains my view that Energy is a secular winner. However, it is highly cyclical in nature. Currently energy equities are very overextended, and current liquidity troubles might also affect the oil price. I shorted these earlier this week (see tweet below)
Europe - I am very concerned about Europe and continue to think the European crisis is underestimated. Debt levels are enormous, and as mentioned before, after years of austerity, further social services cuts are not acceptable. This leaves higher taxes or supressed interest rates (or both) as path of least resistance. The UK has taken a lead role in both, other European nations are likely to follow. European indices rallied 20%+ from lows, this seems overextended
Entertainment - Real-time data tells us a drop-off in entertainment spend, in particular theme parks and casinos. It seems that the reopen catch-up is done, high ticket prices now a deterrence, and casinos in particular are the antithesis to shrinking money supply
China Tech - while the reopen of China’s physical economy will be hampered by epidemic Covid-19 and likely take until the Spring, the Chinese government clearly pivoted its stance. The digital economy can be supported pre-reopen, I remain long this theme
Bonds - Price action in US bond markets was unnerving this week. The sell-off in some cyclical-lead commodities such as lumber should have induced lower yields but didn’t. I expect more turbulence here
US Dollar - Should risk assets weaken, then the Greenback likely strengthens again. It is the risk-off currency, and if the US catches a cold then the rest of the world is sick in bed. This likely also weighs on commodities and gold. I expect persistent US Dollar weakness to return from 1H’23 as the Fed dials back rate hikes or intervenes in turbulent asset markets, just as the economy near its cyclical turn
As highlighted in previous posts, I expect “the low” for risk markets some time in 1H 2023
I hope you enjoyed today’s Next Economy post. If you do, please share it, it would make my day!


Florian, great article thanks. What is you theory behind why the $DAX had such a strong rally. It rallied right out the weekly downtrend channel, and is now is more overbought on the daily RSI, than I have ever seen it. Europe has more problems than the US. $DOW has also been very strong also. Biggest contributor is likely $GS but their earnings are flat. Thanks Stefan
Great article once again. Thank you.