From Hot to Cold in 90 Days
Why inflation will come down fast now (in the US, not Europe)
I hope my readers will excuse my brief hiatus from posting; my wife and I welcomed our second son - Maximilian - earlier this month :) I return today with a fresh look at the current most pressing economic issue, inflation. Having warned of high inflation as early as March 2021 and many times after, I now expect US inflation to cool off materially over the next few months
This likely has some important implications for markets, which I will lay out, as always, towards the end of the post, where I also explain why I am now allocating meaningfully to US Treasury bonds. On this note, much of my analysis is data-dependent, you can follow me sharing this data in real-time on Twitter
Today, US Consumer Price Inflation data was released and again, it came in very hot
While the press focuses on the rear-view 9.1% year-on-year number, for financial markets, the month-on-month increase is much more important as it is instructive for current trends. This came in at 1.3% headline, or 0.7% excluding volatile food and gas (~9-15% annualised)
I believe this to be the high watermark for the cycle, and July/August data to come in much lower already. Why?
Let’s look at some data to discover the answer
First, as we know, facing a harsh reduction in real income (i.e. what’s left of wages after inflation), the US Consumer has started to cut back considerably
Many datapoints show a marked deceleration in consumer expenditure since late April/early May. Take Airfares as an example, which peaked around that time

Used car prices are also on the way down, just as the semiconductor shortage holding back car production is being resolved, with more car supply hitting the market soon
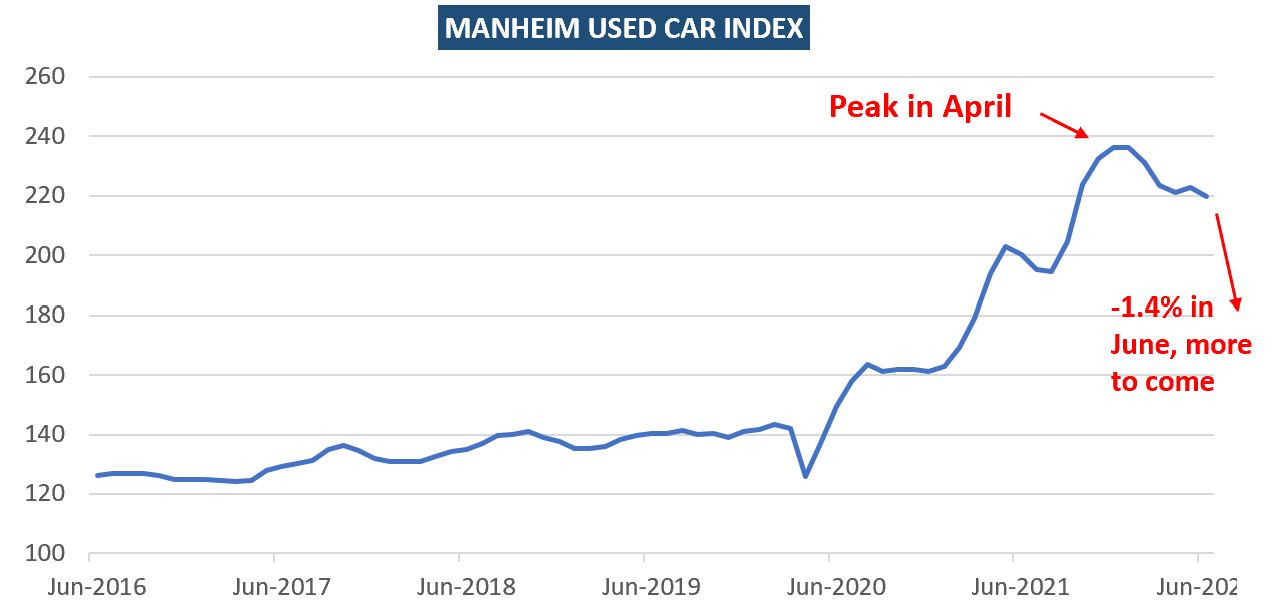
NB: The decline in airfares is only partially, the used car price decline not at all reflected in today’s CPI data, which tracks these categories with a 1-2 month lag
Other discretionary goods also saw steep price declines. Take luxury watch prices as proxy for high-end discretionary goods - they’ve weakened considerably in the last few months

Further, following the Fed’s aggressive rate hikes, and the lacklustre action of other central banks such as the ECB, BOJ or BOE, the US-Dollar has strengthened massively
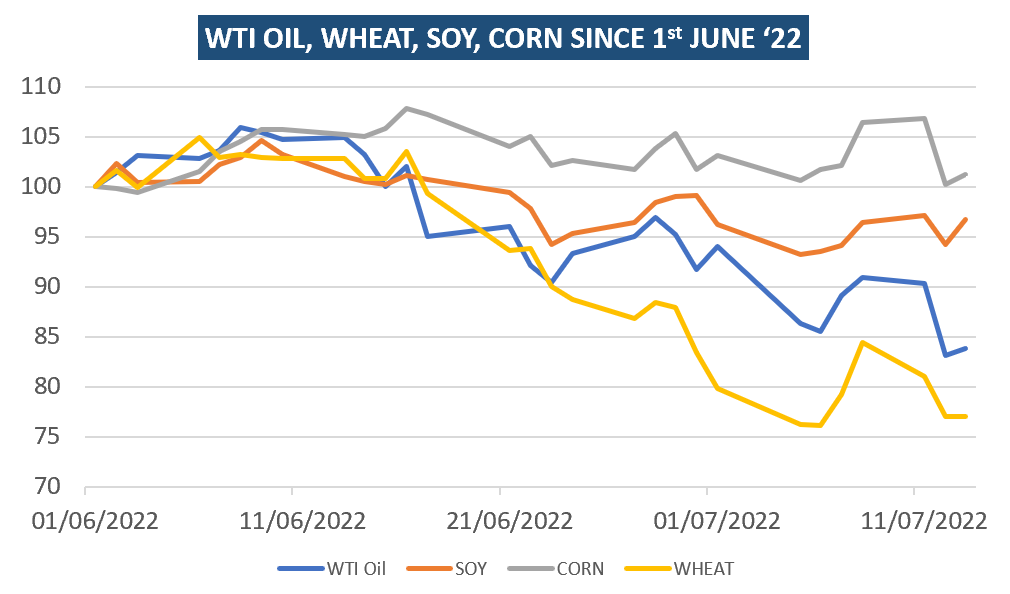
This cheapens US imports (= disinflationary). It also makes USD-based commodity imports more expensive for the Rest of the World, so they cut back. With lower global demand, oil and food commodity prices have fallen considerably
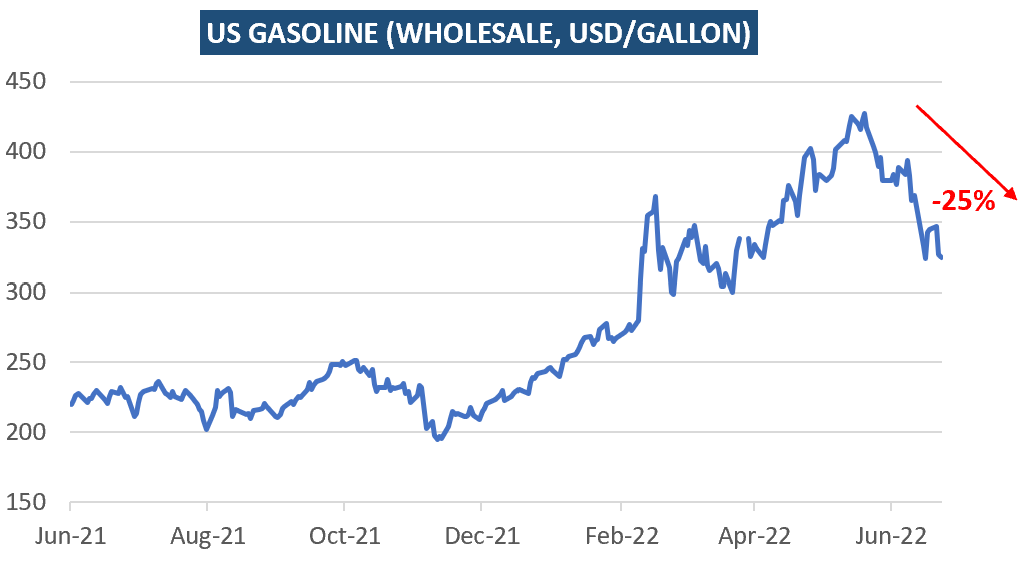
As a result, in the US, the price of gasoline has cheapened 20% since June. Food prices are likely to come down, too
NB: Again, today’s CPI print misses this decline. It only takes the gasoline price from the second week of June
Importantly, Energy and food indirectly influence many other categories. Think of the commuter asking for a raise to cope with high gasoline prices etc.
Finally, there is the big category of Shelter (32% of CPI), which is calculated on a very lagging basis1 and has been awful in today’s release (0.7% m-o-m/9% annualised).
Keep in mind, today’s Shelter CPI data reflects rental increases as far back as a year. Markets will increasingly look past this and at real-time data.
Now, this has also still been trending up:
However, regular readers will be familiar with my view on Housing, which I think shows many bubble characteristics, in the US and elsewhere. This will likely, eventually also show in rents
As the to-buy market likely cools off considerably, additional supply will be provided to the rental market and soften the trajectory of rents soon, in my view. Either way, who is still willing to pay these elevated rents in a slowing economy?
It seems likely to me given that backward nature of shelter in the CPI calculation, we will start seeing many CPI ex. Shelter calculations soon
All these datapoints look at inflation from a bottom-up perspective, for the trajectory of individual goods and services. The topic can also be approached from a top-down perspective i.e. proxies for aggregate demand and money in circulation
In particular, we can analyse (1) how wages grow and (2) how much money is around (e.g. M2). If both expand too fast, while goods and services increase more slowly, we get inflation
Let’s look at wage growth first. This remains positive, but is a clearly declining trajectory2:
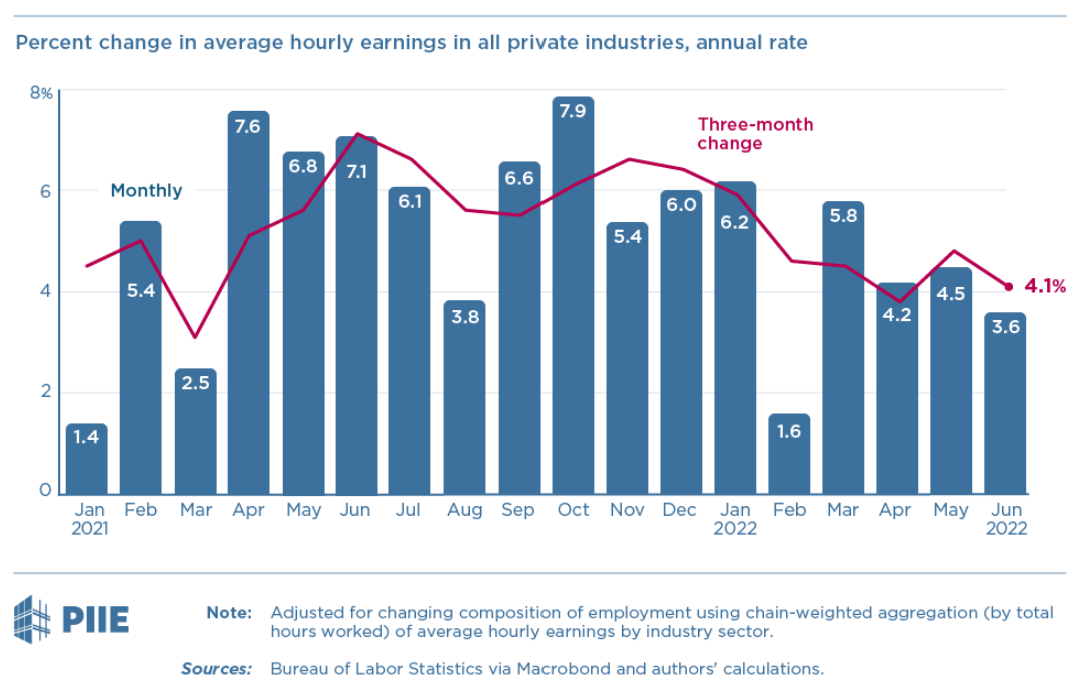
This is not surprising. Yes, we in a very tight labor market, but when the economy turns south, employees and employers become more hesitant in granting and asking for raises
Further, the Fed’s aggressive monetary tightening shows in Money Supply (M2), which has very likely stalled or even shrunk recently
Official M2 data is only available with a considerable lag. However, we can use deposits as imperfect proxy, they are available on a near-time, weekly basis

There are many much more complex nuances to M2, but the basic premise is simple - for inflation to happen, the amount of money in circulation needs to grow. If it doesn’t, inflation will come down3
CONCLUSION: Both bottom-up as well as top-down data suggest a considerable slowing in US inflation in the coming months. I expect the July/August month-on-month CPI headline prints to come down considerably, maybe even close to zero, especially if the real-time cost of Shelter is applied
Ok, that is awesome- everything will be cheaper, the Fed will cave and markets will go up, right?
Not so fast, unfortunately…
First, on aggregate, prices likely stop going up, but it’s not like everything gets cheaper.
A flat CPI month-on-month print just means things stay as painfully expensive as they are, so don’t expect any consumer expenditure fireworks
Second, the reason why inflation likely stalls or maybe even reverts is because the economy is slowing hard, and will very likely continue to do so. So even if consumers can save on gasoline or rents, they likely still spend less because they will worry about unemployment
The economy works like a tanker that turns only very slowly. For now all lead indicators continue to point to a rapidly decelerating economy, such as this week’s NFIB Small Business Survey:
Please see my post “Consumer Cycle, not Business Cycle” for details on the cyclicality of the economy and the lead role of Housing. The next cyclical upturn seems probable towards mid/late 2023, and will likely be frontrun by financial markets by 3-6 months (i.e. late 2022/early 2023)
Third, inflation will probably only take a pause. The structural reasons for higher future inflation are still around
US inflation likely accelerates again when the economic cycle turns up, as de-globalisation, 22 million retiring Boomers4, commodity supply issues, US private sector cash balances and a changed labor market shape an economy different to the past decades
What does this mean for markets?
As mentioned in the introduction, every year there are several big themes with long runways. The first half of 2022 has been shaped by the rise in commodity prices and the rise in interest rates, which in turn has put considerable pressure on long-duration assets (Nasdaq, Unprofitable Tech etc.). A further obvious theme was the declining economy, most markedly visible in slowing Consumer expenditure data since late April/early May
I believe that if inflation indeed slows, it will give rise to a new theme: the decline of US Treasury bond yields, in a multi-month trend, and in particular the “Long End”, 10-year to 30-year duration. Why?
Long-term Treasury yields are priced off two dynamics: (1) economic growth and (2) inflation. We already know that economic growth is slowing hard. Inflation has kept US yields high. If that reason falls away in the eyes of the market, US Treasury yields should come down considerably, until either inflation data or the economic cycle turn up again
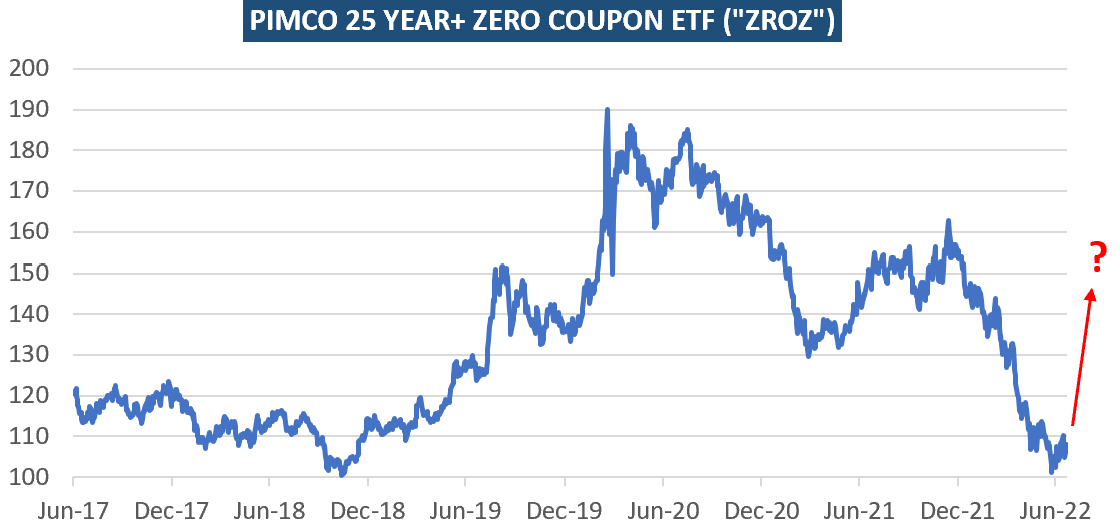
How do I personally play this? Using today’s strong CPI print and corresponding bond selloff, I am now allocating meaningfully to US-Long Term Zero Coupon bonds (e.g. via ZROZ:ETF for 25-Year+ duration) and the standard alternative TLT:ETF (20-30 Year duration)5
Zero-coupon bonds roll up the interest, rather than paying it out, which I like for a variety of reasons
Further, please note that price swings in long term bonds are more pronounced on the long end. If the interest rate goes from, say, 3% to 2%, the underlying price of a 2-Year bond will move much less than a 30-Year bond. So if I am right, the 25-Year will move more
In general, the risk/reward here seems very positive. For rates to go higher (and thus bonds lower), you would need to believe that inflation escalates from here. All the data above speaks against this - but please keep in mind- this view could still, always be wrong!
As always, I take advantage of trading highly liquid investments by setting stop-losses to exit the trade in case I am wrong. In this case at ~101 for ZROZ and 109 for TLT, the previous recent lows. This creates c. 6 down and 30+ up if I am right. A good ratio, if all trades were like that I would only need a ~20% hit rate
Moving on to other asset classes, I’ve closed about half of my mostly cyclical shorts, mainly for risk-reward considerations (XME and SXPP are down ~25% since I mentioned them) and remain with a smaller short book of Nasdaq-100, US Airlines (JETS), European Banks (SX7P), Homebuilders (XHB) and DAX. Some further views in more detail:
Equities: Lower bond yields increase the valuation multiple for equities, which is positive, all else being equal. But all else is not equal, we are facing money supply contraction while the economy slows, and even with expanding liquidity, historically equities have only sustainably rallied as the up-leg of the economic cycle approaches
High-Growth Tech: Lower bond yields have the biggest effect on Tech, which in theory should also show less cyclicality in its revenues and earnings. I remain hesitant with exposure here, as the aftermath of last year’s Tech bubble likely continues to weigh heavily. Also please see ServiceNow’s CEO comments for the strong USD impact, which is particularly painful for US Software with high foreign revenues. The bright light in this area in my view is Biotech (XBI), where I intend to add on weakness
Energy: If the world economy slows hard, as discussed several times before, Oil will go down. Coal however may be an exemption, as it remains extremely tight and is Europe’s default substitute for Russian gas. I’ve made some counter-trend long attempts with energy exposure after their recent sell-off, but have either been thrown out again as tight stops were blown (XLE/OIH), or have to quickly taken profit for lack of conviction (Coal)
China: China faces huge issues with Zero-Covid and its property bubble. The government forces developers to not cut prices as it wants to avoid a large GDP drawdown; 85% of Chinese consumer wealth is in Real Estate. However, at current prices no one wants to buy, so volumes stall and steel/iron ore/copper demand remains weak. If there is no volume, developers run into liquidity issues. Add to that a declining global economy, so fewer exports. China will either need to reflate and blow the property bubble even further, or face social tensions, maybe even unrest
Europe: Europe and Germany are facing the perfect storm of 30 years of bad policy decisions, even if they were done in good faith at the time. European inflation will continue to go up as European energy costs increase, and the recession will likely be severe. Therefore, there is unlikely a linear read-through from US to European bond yields
Credit: Lower bond yields boost credit, all else being equal. However, again, not all else is equal. Given the economy outlook, I expect significant further widening in credit spreads, with the big distressed moment likely further down the road
With all this in mind, please remember that the economy, just like many things in life is cyclical. This is not the first economic crisis, and there will be dawn after the dusk
I hope you enjoyed today’s Next Economy post. If you do, please share it, it would make my day!
The chart depicts NFP Average Hourly Wages for all employees, not just non-supervisory and production workers which many focus on and is the 80% subset. I find this the relevant metric as it includes the total employer’s wage bill, and should be a proxy of aggregate demand potential
Please always keep in mind, I am referring to month-on-month changes, not the rear-view year-on-year
Vs 8 million retiring in that age group in 1981
Other options include IEF or bond futures




Welcome M.K!