Incentives and Inequality
What 13 years of Quantitative Easing have done to the financial system
Quantitative Easing (“QE”) has been transformative to today’s world economy. Initially intended as emergency support during the Great Financial Crisis, it has become a staple feature of Central Bank policy. This post aims to review its role and legacy, which becomes pertinent as the colossal, QE-enabled global debt mountain asks for payback while economic growth slows. Levered loans, European and Japanese pension funds as well as Credit Suisse are likely flashpoints for 2023
As always, this post concludes with an outlook on current markets, where I explain why I have added to shorts in cyclical equities. With recent data, my view increasingly shifts to a “hard landing”. A sharp slowdown much amplifies excessive leverage dynamics, while the Fed won’t easily come to the rescue this time around. Meanwhile, equity markets price in the paradox of a soft landing and lower inflation, creating high asymmetry to the downside
Before we get into the effects of QE, its costs, benefits and the very real risks for today’s economy, let’s start with a brief refresher on the basics:
What is QE?
QE describes the act of Central Banks acquiring financial securities in the open market. This has mostly been government debt or government-backed mortgage debt, but occasionally also corporate debt (Europe) or even equities (Japan).
Why was it introduced?
The primary tool of economic support for Central Banks is to cut interest rates. However, when interest rates are near 0%, the effectiveness of further cuts declines, and many argue that negative interest rates should be avoided altogether. So another way is needed to “ease” financial conditions - QE
First introduced in Japan in 2001, the practise rose to prominence after the Great Financial Crisis in 08/09 when near-zero interest rates did not suffice anymore to stimulate Western economies
Since 2008, global central banks have bought ~22 Trillion US Dollars of mostly government debt securities to support their economies within QE
How does it work?
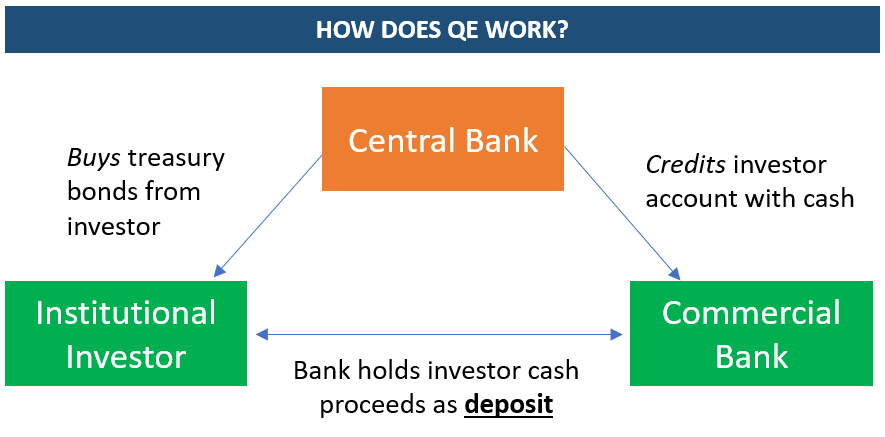
Via its trading desk, the Central Bank buys bonds from large institutional investors (e.g., Blackrock)
In exchange for their bonds, the investor receives cash. As sending large sums via physical notes is highly impractical, this cash is deposited at the investors’ commercial bank account (e.g., JP Morgan)1
JP Morgan now holds Blackrock’s cash as deposits on the liabilities side. To avoid money multiplier effects, it is only allowed to lend this cash to other large banks, for which reason it is booked as “reserves” on its asset side
Now on to the important part - What are the effects? Three areas stand out
1- Wealth Effect
Continuing with the example, Blackrock just sold bonds that provide an interest income in exchange for cash. In a near-zero rates environment, cash has no income. So it goes out to buy something else that provides yield, ranging from other government bonds to high yield bonds to equities or even houses. With more demand, the prices of these assets go up
People who own these assets feel wealthier as their price goes up. The theory goes that this triggers them to spend more, and this increased spending benefits everyone
Previous Fed Chairman Ben Bernanke, a big advocate of QE, spells out this “wealth effect” several times:
Indeed, QE and low interest rates had a tremendous effect on asset prices
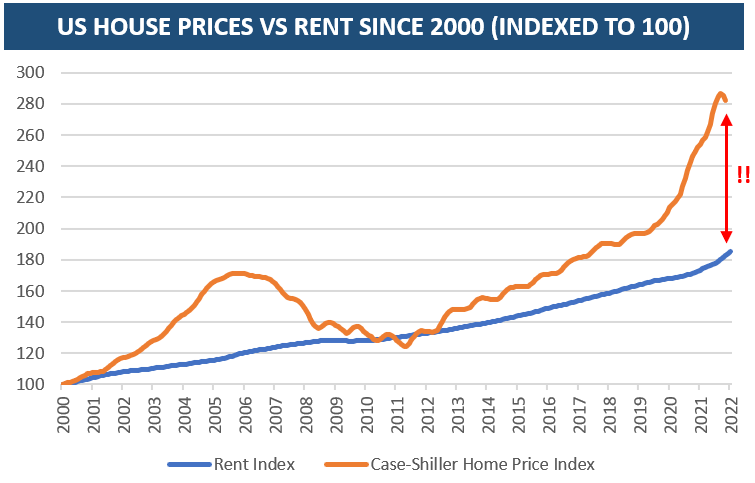
US house prices more than doubled since 2008, and rose much faster than rents, which are driven by wages. The picture is even more extreme in other countries
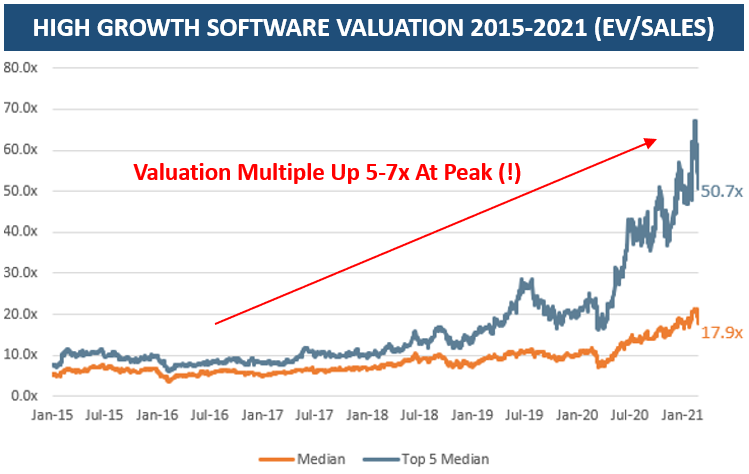
The effect was more pronounced the further an asset was out on the risk curve and the further in the future its cash flows. High-Growth Tech valuation levels grew exponentially:
Effect #1: Asset prices rose considerably, increasing the perceived wealth of asset owners
2 - Market Psychology
Regular readers will be familiar with my view that financial markets are driven by psychology just as much as by economic data
As such, confidence is highly important when making investment decisions. Central Banks as buyer of last resort provided markets with said confidence
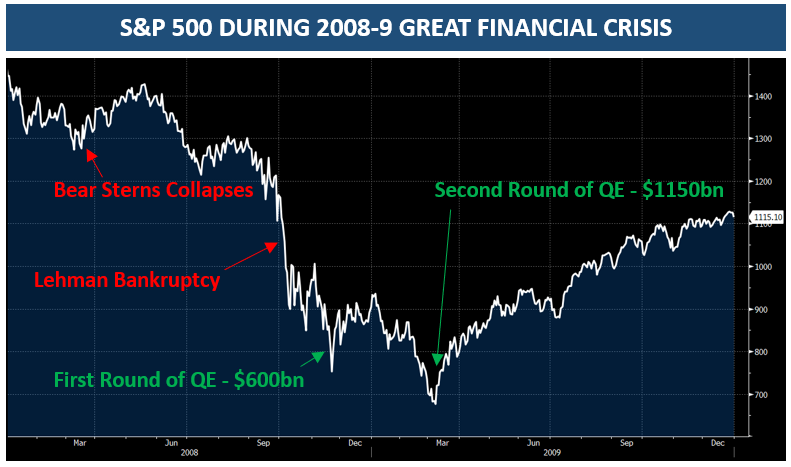
Whether it was Mario Draghi’s “Whatever it Takes”-moment to save the Euro, or the Fed’s interventions in 2008/9, as shown in the chart below - whenever markets felt Central Banks were there and had done enough, they were off to the races
This year showcased the reverse, with considerable tension in US and UK bonds markets following the introduction of Quantitative Tightening. These could only be alleviated with verbal intervention (US) or a return to QE (UK); see my previous post “Tremors” on the topic
Effect #2: Central Bank QE programs gave markets the confidence to take on risk
3 - Balance Sheet Capacity
QE’s impact on wealth and market psychology has frequently been discussed. However, this third effect is overlooked but in my view likely the most important
Through QE, Central Banks provided an overlevered world economy with ample, incremental capacity to assume more debt
How so? Simple - QE increased the demand for credit, both directly and indirectly
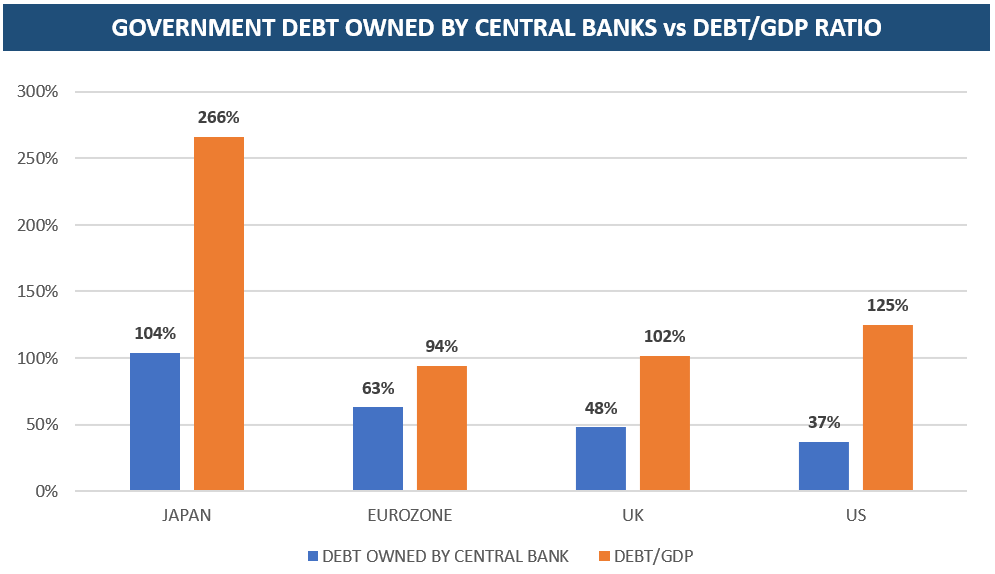
Direct - Central Bank balance sheets expanded by $22tr, making them the largest holders of government debt, in some cases even the majority holder. Many governments are overlevered, who would have bought this debt if not Central Banks?
Indirect - As discussed, QE lowered yields across all asset classes. In addition, the psychology effect reduced perceived systemic risk, so spreads compressed. Lower interest rates reduced debt servicing cost. This invited the assumption of more debt beyond the $22tr of direct Central Bank balance sheet capacity. This even more so if, like Janet Yellen in the example below, one assumed that rates would stay low forever
QE created a huge incentive to assume levered risk. Accordingly, since the Great Financial Crisis global leverage increased by another ~60% of GDP, or ~80 Trillion US Dollars (!)

The huge issue is, leverage was already way too high in 2008!
More so, as discussed, institutions sold low-risk government debt to Central Banks and replaced it with higher-risk alternatives. Thus, today’s institutional asset mix is significantly riskier than before
Effect #3: QE added ample leverage and a higher risk profile to an already overlevered world economy. The global debt mountain grew by ~30% since 2008 when it should have shrunk
More leverage and heavy-handed intervention obviously come at a cost. But how specifically are we paying for QE? Five dynamics come to mind
1- Increased inequality
Let’s take a simple example - housing. Real estate is priced off rental yields. Rental yields are a function of government bond yields. If the rental yield goes from 4% to 2%, because with QE long-term bond yields go from 2% to 0%, the value of the house doubles2
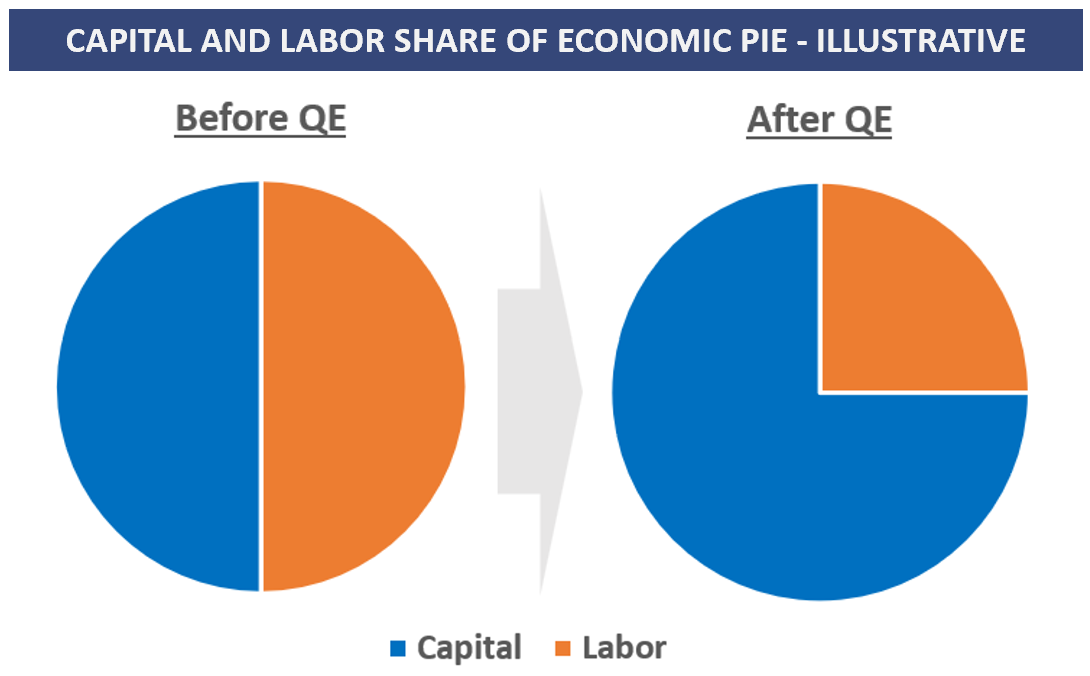
As mentioned, home values indeed more than doubled in many countries between 2008 and 2022. However, as economic growth was anaemic, the overall economic pie barely grew
So if the pie does not grow but asset prices increase, something else has to give - and that something is the relative value of income and labor
Staying with the housing example, for those that did not own assets, home ownership went out of reach as asset prices skyrocketed but income did not
2 - Inability to save
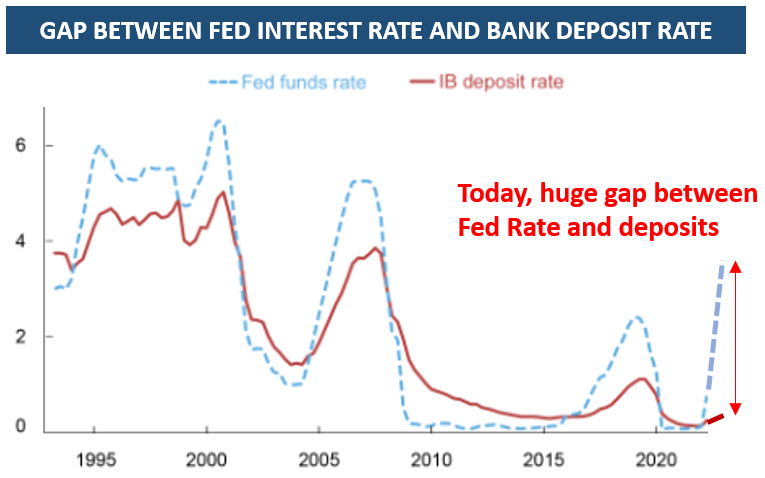
To add insult to injury for non-asset owners, ultra-low rates also meant that savings could not grow by generating interest income. So not only did assets get more expensive, the road to them via savings was also inhibited
This issue remains to this day, even though interest rates have increased. QE created a glut of deposits at commercial banks. Today, they do not feel the need to pass on higher rates to their customers as they have too many deposits anyway. Customers leave deposits anyways as they are unaware or slow to react
3 - Capital misallocation
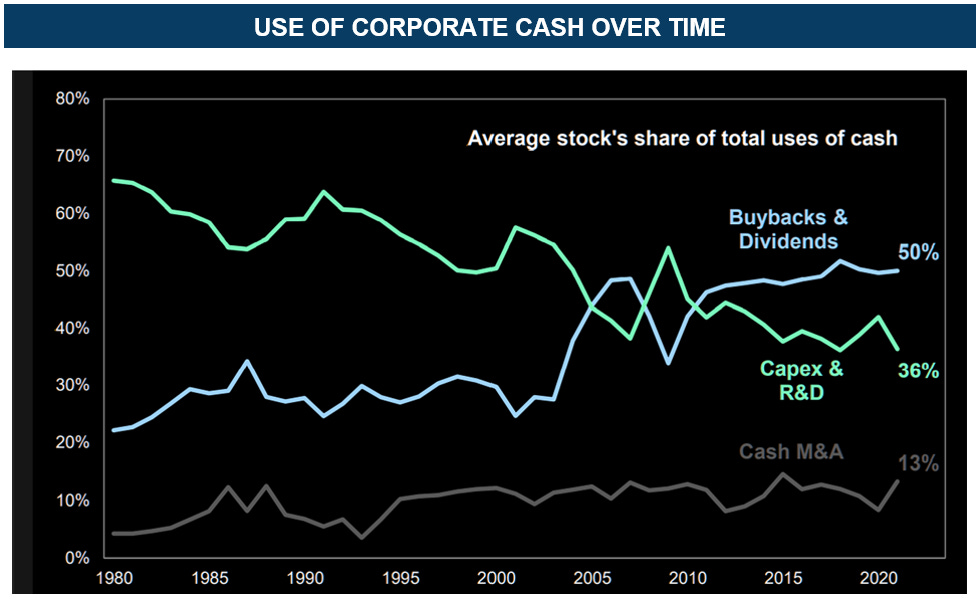
The beauty of debt is that it is easy, and this fact shows in corporate investment decisions. Management teams, whose compensation is often tied to earnings per share (or equivalents) could boost these earnings either via the hard way - with ingenuity required for Capex and R&D. Or they could choose the easy way - lever up and use proceeds for buybacks and dividends
QE and its lowered cost of capital incentivised debt over ingenuity, as this chart vividly shows:
4 - Talent misallocation
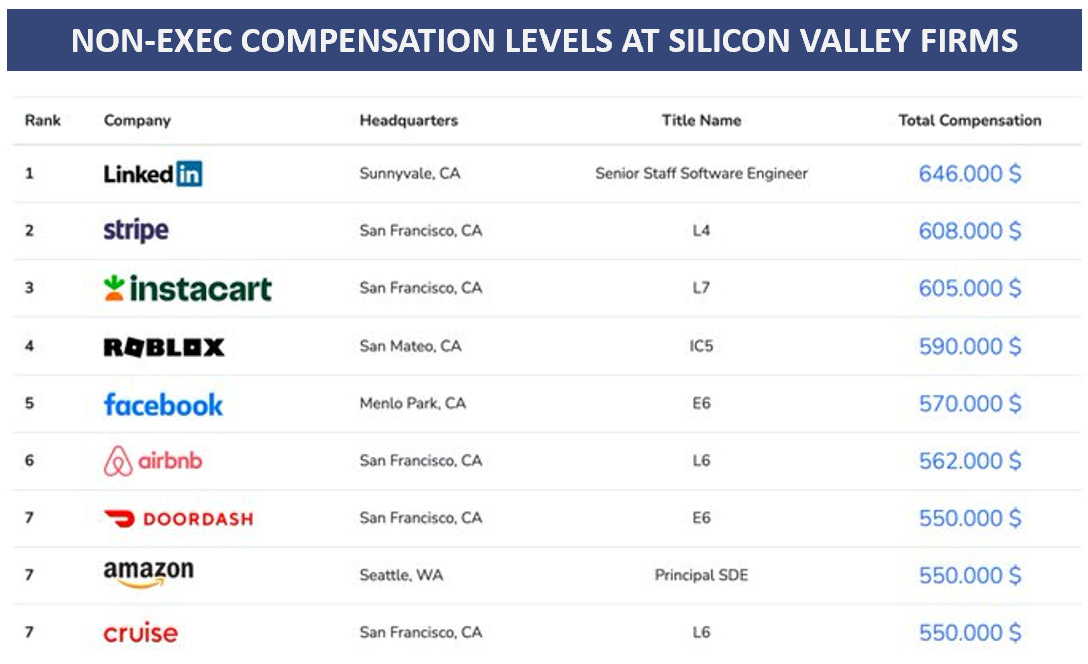
People follow the money, we all do, one way or another. QE inflated Tech valuations, this inflated share prices and share-based compensation. Silicon Valley firms could afford astronomical salaries which attracted talent. The current Tech firing rounds and overstaffing debate show this talent was likely more needed elsewhere
These are already tough dynamics to consider. But the bigger, biggest cost comes in the combination of high leverage and asset bubbles. Why?
We see circular dynamics at work when asset prices increase and leverage increases
Higher asset prices increase both confidence and the value of collateral
Higher confidence and collateral value leads to more leverage
Eventually, the cycle turns. Confidence and asset values decline, yet leverage remains the same
Historically, this dynamic often played out in real estate markets, and as an extension thereof real estate’s biggest lender, the banking sector
However, this time around, I believe problems to arise from a very different area - private credit and levered loans. Why?
Following the Great Financial Crisis, both banks and mortgage markets became heavily regulated to avoid a future repeat of the same
As banks cut back risk, their lending books barely grew. But with low rates and QE, demand for credit was high. The gap was filled by private credit funds who raised money from institutional investors to lend mainly to corporates, and often in private equity LBOs, then often repackaged as CLOs
Unsurprisingly, the private credit market grew with 7% p.a. over the past decade, vs 3% for bank lending, and today is $1.5tr in size. Because it is private, it is also unregulated. This means animal spirits can run unchecked, which is exactly what happened
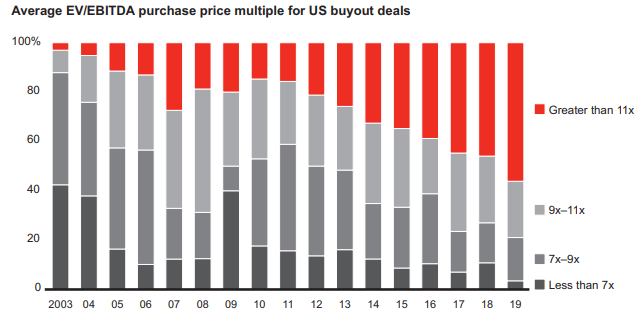
Let’s look at two simple charts for PE-led levered buyouts over the past years, they say it all:
Exhibit A: Valuation levels went through the roof
Exhibit B: Leverage went through the roof
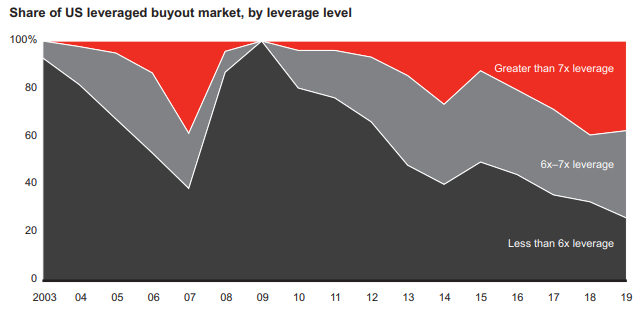
The classic asset bubble + leverage constellation
What these chart do not show: As valuations rose and confidence increase, care often went out of the window. Asset quality decreased, often inexperienced management was put in place, covenants were watered down etc. etc.
In addition, only ~33% of these loans are fixed-rate, when higher rates only kick in at refinancing. The remainder is floating, where higher rates immediately translate to higher cost
Now, what happens to corporate earnings when the economy slows? They go down. What happens if we get a hard landing and asset quality is poor? Earnings go down a lot
In addition, with higher rates and the Fed fighting inflation, interest rates have gone up, and with it, debt servicing costs - the perfect storm
S&P estimates indicate that c. 50% of the levered loan universe will be cash flow negative if earnings revert to 2019 levels and interest rates rise by 300bps
Yesterday, we got an eery reminder of the storm brewing in private markets. Blackrock limited redemptions from its juggernaut Real Estate fund “BREIT”

BREIT is symptomatic for private markets: It is marked at +9% ytd while publicly listed peers are down ~25%. This frankly seems nonsensical given more than half its assets are in multi-family, which faces considerable overbuilt issues. It is highly levered, with $56bn of debt
In my view, a large part of the levered loan universe won’t be able to service its debt over the next year, with defaults to follow. The question is then, who owns these loans?
Private markets are by definition opaque, however large holders are likely US institutional investors (endowments etc.) as well European and Japanese insurance
Since 2009, following the AIG bankruptcy, US insurers can only hold investment grade debt. Banks have also moved away from this market
However, one bank went out the risk curve to gain market share, with internal risk controls seemingly absent. It has since been entangled in several blow-ups, from Archegos to Greenshill - Credit Suisse. Looking at where their CDS trades and their CHF700bn balance, I would not be surprised if some “dead bodies” turn up there
Summary: QE lead to a boom in private credit, where care once again went out of the window. Levered loans are a likely source of defaults and market turmoil in 2023
Ok, so the costs are enormous. But what are the benefits, was it worth it?
Economic literature is divided on the merits of QE, with many researches judging no or only ephemeral effects (see a meta-study here). Here is what I think, drawing from my own markets experiences at the time:
The two initial QE programs in 08/09 likely prevented a downward spiral and stabilised the market at a very critical time. March 2009 in particular was a very dark moment, and without assistance, a 1930s-like depression could have been in the cards. These were likely worth it
Without early European QE programs such as the 2010 SMP, it might not have been possible to keep Italy and Greece in the Eurozone. Their interest rates would have spiralled out of control and likely forced a currency devaluation only possible outside of the Euro. The cost of an abrupt Southern exit would have involved more than just financial damage, affecting the very premise of the EU’s existence. In my view, again, some of the early-stage European QE was likely worth it
At times, QE for a limited period was possibly justified. It should have remained that - an emergency medicine that buys time to address the root cause of the disease. Instead it became a permanent fixture of Central Bank policy
The US QE programs of 2010, 2012 and 2019 (“repo crisis”) or the ECB programs from 2014 did not coincide with economic emergencies. And the mistake of the colossal QE amounts implemented over Covid-19 has been discussed at length
In each case, very unhealthy financial and economic incentives were exacerbated. They benefited asset owners, increased inequality and made lower income groups furious. Was a single additional, sustainable job created thanks to these late QE programs? I am not sure
I cannot help but note that the enormous extent of QE occurred because it was (1) easy to implement, (2) hard to comprehend for the broad public and (3) because it enormously benefitted those close to power, even if this wasn’t obvious at the time
Economic policy resistance works via lobbying, especially in the US. And over the QE-decade, the strongest lobby groups had little to complain about
Conclusion: QE was very likely not worth its steep price. Still, much of the fallout likely lies ahead as the world economy is left to deal with a debt mountain of historic proportion
A few decades down the line, I don’t think history will look kindly on this tool and its excessive application during the 2010s
What does this mean for markets?
As always, below is my personal attempt at connecting-the-dots for my own investments. Please keep in mind - I may be totally wrong, nothing is more important than risk management, and none of this is investment advice
My long-term view remains one of higher inflation for longer
I believe a hard landing will eventually be remedied with more fiscal stimulus, assisted by central bank yield curve control and a higher inflation target. See Paul Krugman and Oliver Blanchard arguing for a 3% inflation target recently. In my view, there is no public tolerance for any measures that increase inequality further, and little tolerance for high unemployment after twenty years where “the poor got screwed”. This likely leads to higher inflation for years
Equally, reshoring and energy transition trends likely continue to shape Western economies, such as Toyota’s recently tripled $3.8bn investment for its North Carolina battery plant
As such, I continue to see Energy (XLE), Healthcare (XLV), Alternative Energy (TAN), Commodities (XME), especially related to clean energy transition (Lithium, Copper), Biotech (XBI), Banks (XLF), Royalty Businesses (e.g., in pharma, ERP in Software) and Gold as winners over the next 5 years
My short-term view is different, driven by what likely happens over the next 3-6 months, and thus very much influenced by the current stage of the economic cycle. I see growing reasons for a hard landing
Recent data deteriorated sharply, especially in Europe, but also in the US where the Chicago PMI fell to the lowest level since the Great Financial Crisis (excluding Covid)
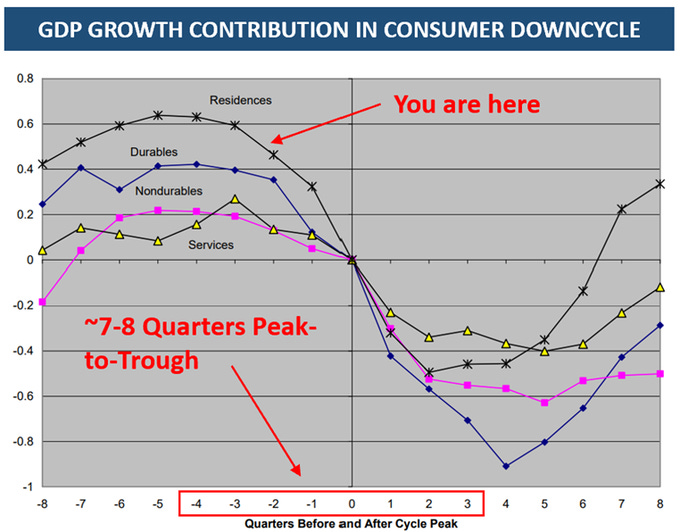
Coming back to the economic cycle, pictured below (see “Consumer Cycle, not Business Cycle” for details), please note the steeper slope ahead, the data implies we are likely on its precipice
Now, as discussed, debt levels are high and debt service costs increase with higher rates. A hard landing decimates corporate EBITDAs, who will fight it with aggressive cost cuts, which likely amplify the slowdown
At the same time, the Fed will be slow to react given persistent inflation and its forward-looking communication. Outside of the zero-interest era, the Fed was already cutting rates or within 3 months of cutting rates when economic data was as bad as it is now
Meanwhile, markets have rallied and positioning has cleared (discussed before here).
Equity markets are set up for much downside, should a hard landing materialise, while a goldilocks world of soft landing + lower inflation is currently priced in. I have therefore used this latest leg of the equity rally to add further to shorts in cyclical industries, including Industrials (XLI), Commodities (XME, SXPP), Energy (XLE), DAX and Casinos (CZR/MGM)
Some further thoughts
Labor market - The “trillion dollar question” in my view remains how the labor market evolves during the downturn. I’ve laid out strong arguments in favor of continuously tight labor markets, from the demographic cliff to an unprecedently high vacancies vs unemployed ratio. However, we are in unchartered territory and many permutations are possible, e.g. could unemployment increase while vacancies remain high as skills do not match? Recent ADP data points to first employment losses in manufacturing, which together with housing traditionally lead unemployment increases
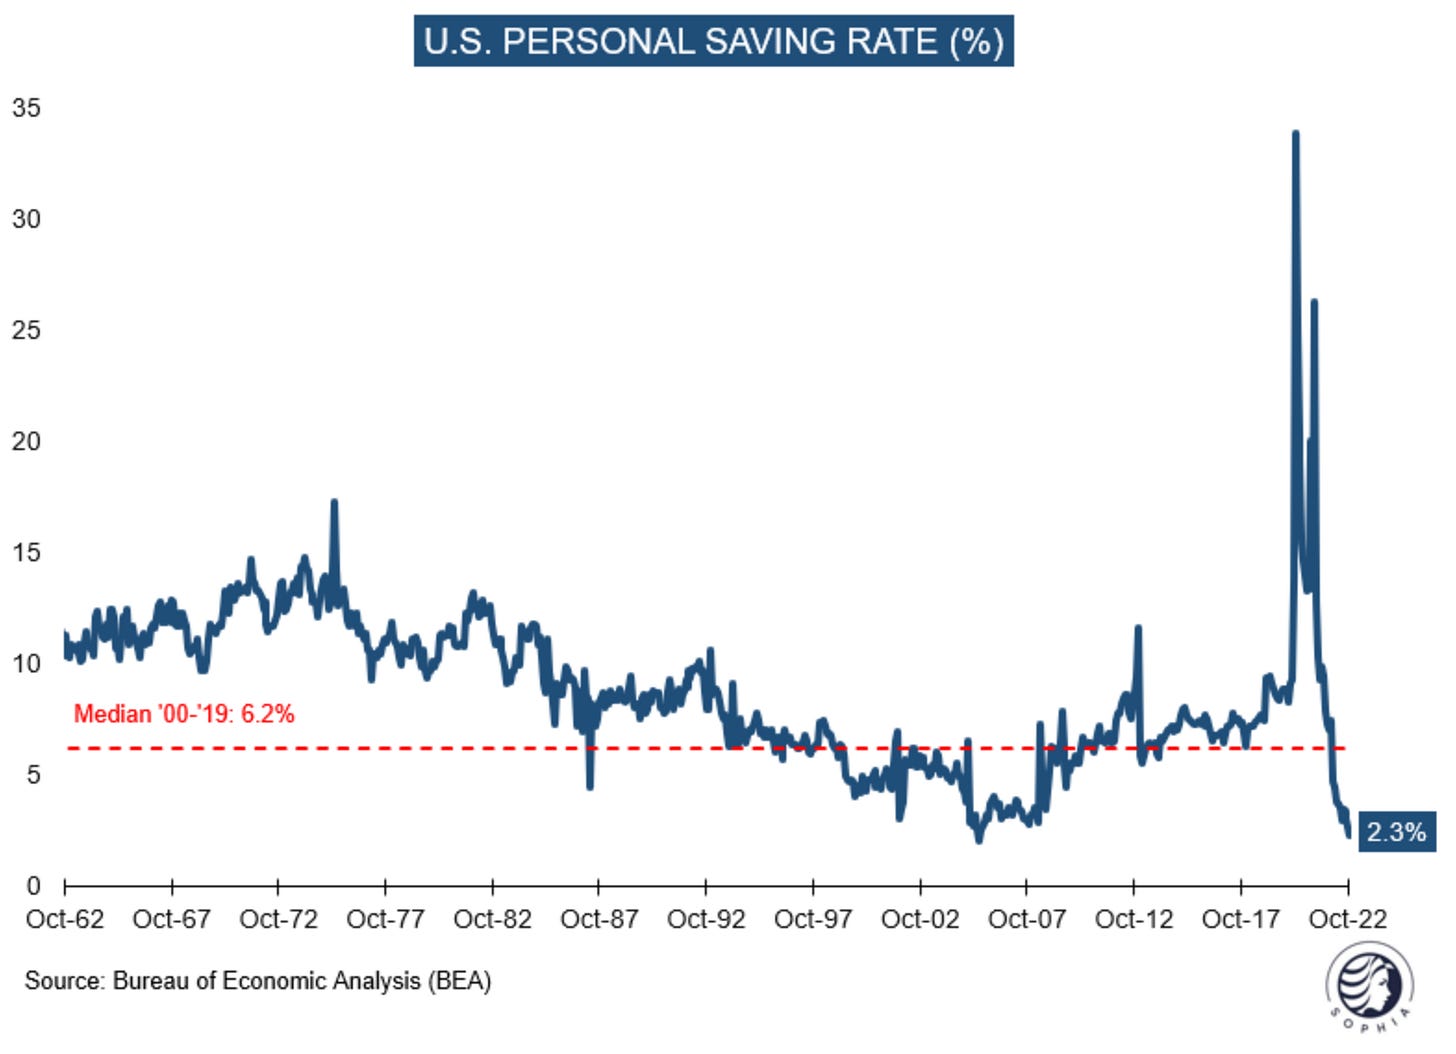
US Consumer - After a very tepid start to November, Black Friday sales turned out in line for physical stores and better than expected for ecommerce amid heavy discounting. The jury is still out on US consumer strength, but I would highlight the following: October ‘23 showed the second lowest personal savings rate on record, clearly an unsustainable state. Pandemic excess savings run out by mid-’23, with lower-income demographics already maxed out. If anything, the US Consumer lives on borrowed time
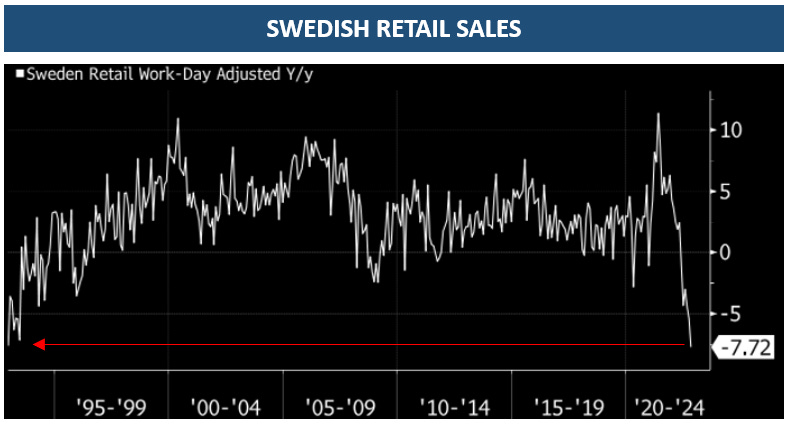
Europe - I am very concerned about Europe. As higher energy and mortgages cost bite, retail sales are going off a cliff, while cold weather brings back higher gas prices. A recent announcement by VW’s battery arm Northvolt illustrates some tough dynamics. The company is “rethinking” a factory investment in Germany due to both high energy cost as well as attractive US subsidies as part of the inflation reduction act, where $350bn is earmarked for new technologies. The attraction of these subsidies for EU companies is noteworthy just as the US also becomes the preferred European gas supplier via LNG imports. Are the States bleeding out the old continent?
China Tech - I have used the recent rally to exit this sector. It has been one of the most profitable trades of the year, with a 40%+ return over a month. Tailwinds remain in place, but China is still a turbulent jurisdiction and one should leave a party while it is still fun
US Dollar - Should I be right and risk-off returns to markets, the US Dollar is likely to see a strong bid, in particular against its European counterparts
I continue to expect “the low” in equity markets some time in 1H ‘23
I hope you enjoyed today’s Next Economy post. If you do, please share it, it would make my day!
DISCLAIMER:
The information contained in the material on this website article reflects only the views of its author (Florian Kronawitter) in a strictly personal capacity and do not reflect the views of White Square Capital LLP and/or Sophia Group LLP. This website article is only for information purposes, and it is not intended to be, nor should it be construed or used as, investment, tax or legal advice, any recommendation or opinion regarding the appropriateness or suitability of any investment or strategy, or an offer to sell, or a solicitation of an offer to buy, an interest in any security, including an interest in any private fund or account or any other private fund or account advised by White Square Capital LLP, Sophia Group LLP or any of its affiliates. Nothing on this website article should be taken as a recommendation or endorsement of a particular investment, adviser or other service or product or to any material submitted by third parties or linked to from this website. Nor should anything on this website article be taken as an invitation or inducement to engage in investment activities. In addition, we do not offer any advice regarding the nature, potential value or suitability of any particular investment, security or investment strategy and the information provided is not tailored to any individual requirements.
The content of this website article does not constitute investment advice and you should not rely on any material on this website article to make (or refrain from making) any decision or take (or refrain from taking) any action.
The investments and services mentioned on this article website may not be suitable for you. If advice is required you should contact your own Independent Financial Adviser.
The information in this article website is intended to inform and educate readers and the wider community. No representation is made that any of the views and opinions expressed by the author will be achieved, in whole or in part. This information is as of the date indicated, is not complete and is subject to change. Certain information has been provided by and/or is based on third party sources and, although believed to be reliable, has not been independently verified. The author is not responsible for errors or omissions from these sources. No representation is made with respect to the accuracy, completeness or timeliness of information and the author assumes no obligation to update or otherwise revise such information. At the time of writing, the author, or a family member of the author, may hold a significant long or short financial interest in any of securities, issuers and/or sectors discussed. This should not be taken as a recommendation by the author to invest (or refrain from investing) in any securities, issuers and/or sectors, and the author may trade in and out of this position without notice.
JP Morgan now holds Blackrock’s cash as deposits on the liabilities side. To avoid money multiplier effects, they are only allowed to lend this cash to other large banks, for which reason it is booked as “reserves” on their asset side. See detailed explanation here by Bank of England or here by Federal Reserve
Example calculation: Rental income €100k, 4% rental yield = home value €2.5m. Rental income €100k, 2% rental yield = home value €5m.






Excellent piece. Former Fed Chairman William McChesney Martin said, you have to take the punchbowl away just when the party is starting to get hot. Greenspan and his successors kept making trips to the liquor store to get more punch! This can't end well!