
It's all one Big Trade
How capital allocation has moved from silos to bird's eye view

Recently, several big Hedge Funds have made headlines with deeply negative performance figures. While the industry has always provided its fair share of drama, these developments shine a light on how capital markets have changed, with implications far beyond just this asset class
Today’s post walks through the structural reasons for this recent turmoil, and what approach might take the baton from the currently prevalent strategies
As always, the post concludes with my current thoughts on markets
After an underwhelming 2021, Hedge Funds on aggregate followed with an even worse 2022
The below table shows Hedge Fund performance so far this year, split by strategy and region. While there will be many positive exceptions amongst the ~10,000 worldwide Hedge Funds, the average fund is down, and many significantly so

Now, despite all prejudice, Hedge Funds employ some of the smartest and most hard-working people the labor market can provide. This begs the question - how can this financial Armageddon be explained? In three steps, in my view:
First, assets-under-management mushroomed over the past two decades

More assets means more competition, more competition means lower returns
Second, most Hegde Funds are invested in Silos. Simplified, there are three Silo categories1:
Industry: Many funds specialise in an industry such as Internet, Commodities or Luxury. As experts in their field, they predict which companies will do well and which won’t. Equity long/short funds typically follow this model, as do many platform pods
Strategy: Alternatively, funds focus on a strategy such as merger arbitrage or distressed debt. They will operate across industries, but only trade as these special situations occur
Theme: Many funds are also organised along themes such as technological change. This would involve going long technology winners (e.g. streaming platforms) and short technology losers (e.g. cinemas). Many “Tiger Cubs” fall into this category
Today, most of these Silos are very crowded. Exceptions are shorts, non-ESG and small caps - all strategies that many either find unpleasant or don’t scale. The more crowded the Silo, the lower the return
Third, while Silo-specific returns became difficult, the last decade was shaped by a raging bull-market. This provided many funds with a seemingly easy way out. They could replace hard-to-come-by alpha with beta - industry speak for replacing skills with just buying the market
Over the past 12 years, the S&P 500 rose 15.7% p.a.. Over the past 3 years, it rose 26.2% p.a. (both incl. dividends). This compares to a long-term average of ~6%.
The market got used to central banks stepping in each time the market declined. In such an environment, the biggest risk-takers got rewarded the most, while value investors went mostly extinct
The bull market seduced many investors to assume too much market risk, which was violently exposed this year
Despite the grown Silo-specific efficiency, we still see enormous swings in financial markets. Why is that?
While most investors focus on company-specific information, this is only part of what changes a company’s fortune and thus moves the stock price. Macroeconomic developments play the biggest role
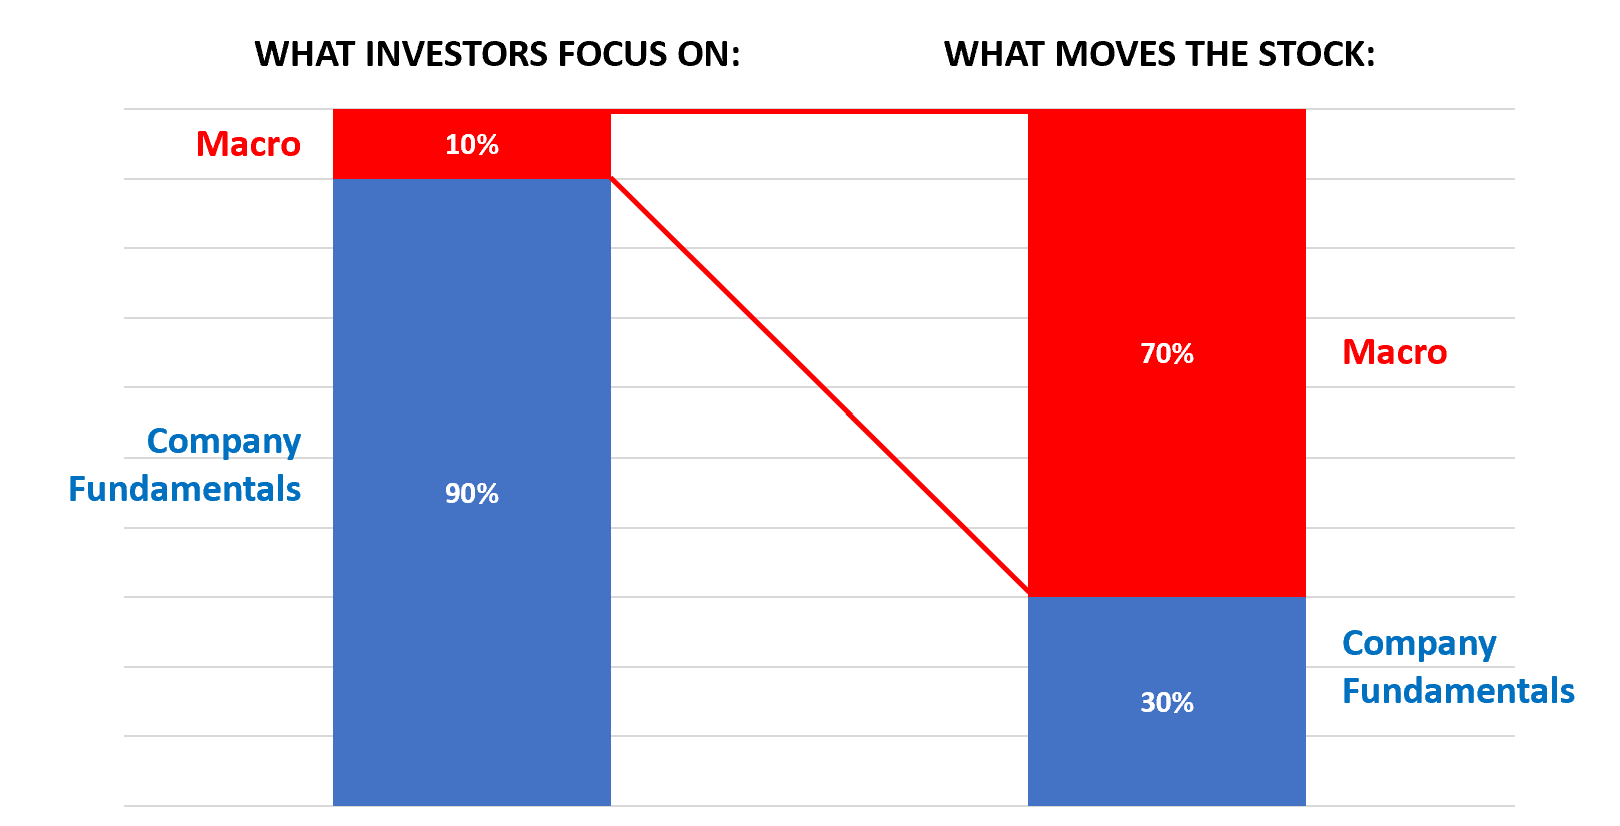
But what are these macro drivers? They can be grouped into two categories:
Government debt interest rates, which represent the “risk-free” rate off which all assets are priced. With the US consumer representing ~25% of world GDP and the US Dollar ~75% of trade finance, the US Fed’s decisions are the global benchmark here. Interest Rates are key to relative valuation
The economic cycle, which (1) affects corporate earnings and (2) influences central bank decision-making with regards to interest rates. The economic cycle begins in housing, followed by consumer durables and business capex, to end with changes in employment. Housing, in turn, is deeply connected to the level of interest rates. The economic cycle is key to near-term earnings
As all these variables are related to another, you might sometimes hear the adage “It’s all one big macro trade”
To illustrate this dynamic, let’s look at how fashion e-tailer Farfetch traded following its Q2 earnings this past Thursday
After the release, it first dropped -17% in after-hours trading on what was perceived a “miss against expectations”. However, the next day it rallied 50% off those lows. How can that make sense?

It does make sense when we take into account the Silo-dynamics and the role of Macro:
Farfetch’s fundamental development over the past quarter was well understood by the industry specialists following the company (Russia business closed, Shanghai in lockdown etc.)
As a result, they were largely short its stock
The afterhours -17% print happened on low volume and was not representative
The big move the next day was driven by the bear-market rally in high growth stocks, which rested on oversold conditions in combination with stalled interest rates (please see recent posts on this topic)
Conclusion: Macroeconomic drivers were far more important than company-specific fundamentals. In fact, the crowdedness in shorts amplified the macro-driven move
For market participants oblivious to these dynamics, investing becomes incredibly frustrating. Nevertheless, many equity investors maintain the notion that macroeconomic developments are uncallable, and should therefore be ignored
I emphatically disagree with this view. In fact, I would say it is precisely because so many equity investors ignore the macroeconomic picture, that large price swings take place
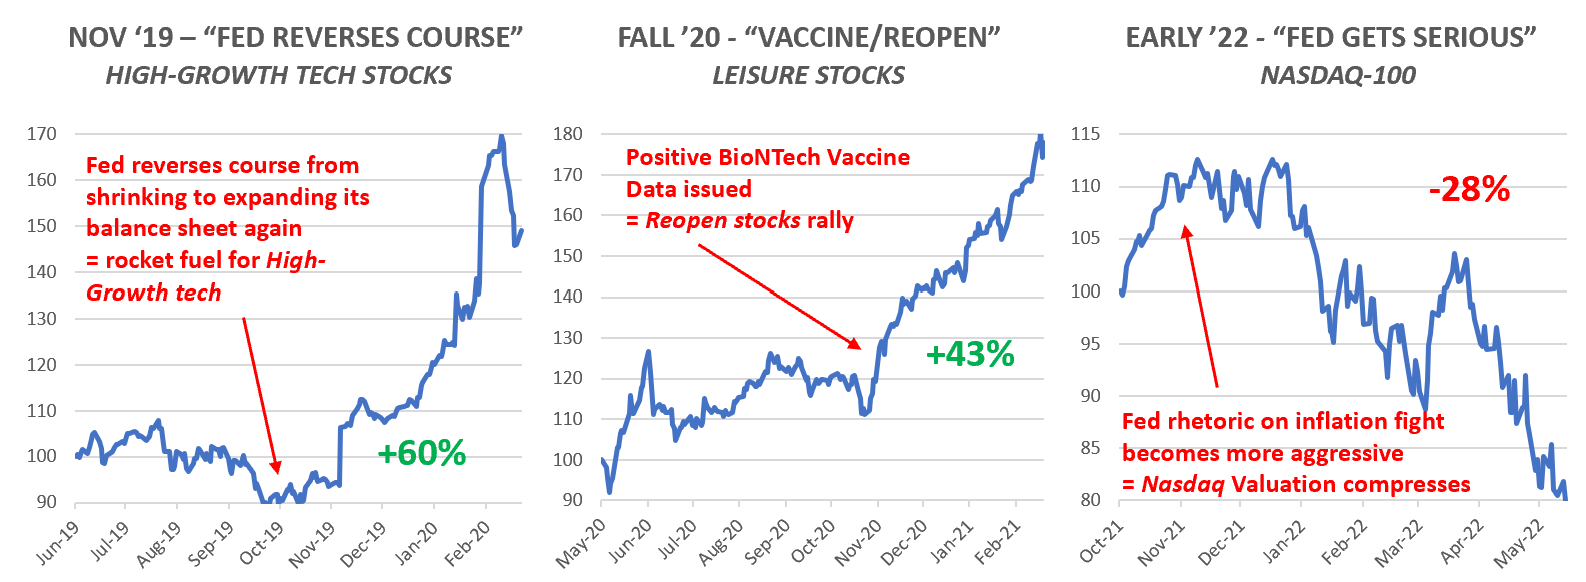
The charts below show examples for drastic moves following macroeconomic developments that had been well telegraphed in advance
Ok, so what can be done? How would such a strategy be run? In my view, there are four components to it
Awareness of the current situation. This is achieved by what could be paraphrased as “Nowcasting”. Every day, dozens of news and datapoints hit the wires2. Further, on a regular basis, central bankers guide the public on expected monetary policy decisions. Both are instructive for the state of the economy and the direction of interest rates
Awareness of historical examples. The basic makeup of human behavior hasn’t changed in 300,000 years. We all follow incentives to fulfil our needs. For that reason, decisions that have been taken in the past may be instructive as to what decisions await us today
Good judgement. Interpreting said information with good common sense is a function of both experience as well as personality traits. Some may have a more positive or more negative disposition, and certain times favor one style more than another
Risk management. The future is complex and uncertain. One’s own judgement is fallible and inconsistent. As such, any investment could go wrong. I integrate this recognition into my investments by always looking at the maximum possible loss if all investments went wrong, and I define in advance at what stop-loss I exit, looking to let winners run and cut losers early
Interpreting macroeconomic developments is an ever-evolving process of Connecting the Dots - the many previous “Next Economy” posts are examples of this practise
And while my perspective is centered on public markets, I believe these conclusions are also relevant for many private strategies
As mentioned, while history never repeats, it often rhymes, and the current period finds most historical similarity with the 1970s
Below charts compare US Treasury bond yields during both periods. While the last 15 years saw huge tailwinds for asset managers from declining bond yields, anything remotely close to a rewind of the 1970s would pose enormous challenges to the asset management industry

In light of this, one aspect will likely become much more important - Timing
We likely face a volatile environment in yields and asset markets. As such, the right entry and exit points will make all the difference for returns that could previously rely on the comfortable tailwinds of ever-declining yields
This is true for public just as much as for private markets. And in a way, it blends the role of fund manager and capital allocator, as value shifts from knowing the industry details to timing the entry point
Summary: The asset management industry faces tremendous challenges. As Silos have become ever-more efficient, it is likely agile and unbenchmarked bird’s eye view strategies that can thrive in what looks to be a much more volatile landscape
What does this mean for markets?
As always, this section provides you with my own efforts of “connecting the dots”. Having been negative on risk all year with a brief March interlude, I recently called for a near-term bottom in US-Tech, in particular Software and Biotech3. Sentiment had gotten excessively negative, and bond yields stalled their advance, providing a bid for long-duration assets
The rally has materialised, the question now is - was that it or is there more to come?
Historically, bear market rallies retraced ~66% of the prior down move, which would suggest we have more to go
More so, this could of course also be the beginning of a much longer upward trend, as all bull markets are born in deep scepticism
However, I find it likely that the sell-off ensues again soon, for the following reasons:
Housing and durables goods: These track very poorly. Please note that a decline especially housing cannot be seen in isolation, it has ripple effects across the entire economy (Please see “Consumer Cycle, not Business Cycle” for more details). US new home sales are down by the most in nearly nine years. Fewer sales → less need for new build homes → less economic activity
The personal savings rate has now gone down to 4.4%. It is not sustainable to spend out of savings! See post “The New Role of Government” on this topic. I find this very concerning
And, as mentioned in my last post, US gasoline prices continue to appreciate:

This is in spite of growing signs of demand destruction. Gasbuddy data indicates a significant slowing of gas consumption over the Memorial Day weekend
If the US consumer cuts back on gas, imagine the burden for consumers in the rest of the world (or their governments, if they subsidise fuel expenditure)
In my last post, I had mentioned gasoline >410$/bbl as exit signal. As that has been hit, I’m accordingly reducing exposure in Tech again after this bounce. Going forward, I intend to slowly scale further into shorts on the cyclical side, and be patient to wait for good risk/reward entry points for that
For this I had previously mentioned Homebuilders (XHB), US Airlines (JETS), Luxury and the DAX. The time will also come for Metals & Mining (XME), which in previous global recessions has always declined >50%, but for the moment may see some tailwinds from China’s reopening
For anyone not wanting to trade actively, I can only repeat my view that cash is king. There will likely be more rounds of forced selling later this year - owning cash has much value then
On that note, I appreciate that the yields on US long-term bonds may have some attraction. But I frankly don’t trust them yet. Inflation is a very complex matter, and while we’ve likely seen its peak, it remains unclear how quickly especially services inflation would come down. We may still be in for some unpleasant surprises
For sake of simplification I have excluded Quantitative Hedge Funds from this categorisation. I’ve also excluded Macro Hedge Funds, of which most are focussed on rates and currencies, and less so on either single stocks, sectors or even equities as a whole
Examples include S&P Manufacturing PMIs, AtlantaFed Wage Growth Tracker, NAHB omebuilder Survey, Watchfinder’s secondary market Rolex prices, Indeed Open Positions, Redfin Housing Inventory, CPI and PCE data, API and EIA oil inventory, Manheim used car index, Political opinion polls
Biotech is a good example for the dynamics outlined in this post. Out of the 10 best performing hedge funds over the past ten years, 5 are Biotech funds. However, the vast majority of investors jumped aboard after that performance, in 2020/21. Last year, the reckoning came, with the same funds down 30-40% at year end. They had become too big, the edge was gone. The XBI has sold off more since, culminating in forced selling in early May as YTD drawdowns became unbearable. This created an entry point for an unconstrained investor