On Liquidity
The twin brother of the economic cycle
I hope everyone is enjoying the summer. My family and I continue to enjoy precious moments with baby Maxi, I thank everyone for their congratulations!
In my last post, I laid out the case for peak inflation and long treasury bonds. The US 10-Year yield has since contracted from 3.1% to 2.6%, a significant move in a short period of time. This has once again brought interest rates into the spotlight, and with it more broadly, the role of liquidity
Liquidity is the twin brother of the Economic Cycle, they are closely intertwined. It is also the topic of today’s post, which rounds off my prior posts on the Economic Cycle (e.g. here or here)
To reach my views, which form the basis for my investments, I follow a data-driven framework, many details of which I now share “open-source” on Twitter, just as much as with the “Next Economy” posts. I believe the hive mind of freely shared online knowledge has tremendous potential, and publishing and investing are two disciplines that belong together - stay tuned for more news on this
As usual, the post closes with my current view on markets, where I explain why I used the equity rally to once again increase market shorts
To start, let’s briefly refresh where we currently stand in the Economic Cycle1
Where does the cyclicality in the economy come from? Most of our daily expenditure is not cyclical at all. Think of phone bills, food, or health insurance, all these are regular and stable occurrences
However, there are also large, expensive items that we only acquire every few years or decades, such as Housing and Consumer Durables (cars, TVs, etc.)
Housing in particular is an emotional good which is prone to bubbles, which are often followed by a steep decline in activity. Housing is highly cyclical
This decline has a domino-effect on the remainder of the economy. How? Here’s an exemplary chain of events: less new home construction → less demand for builders → less demand for Ford pickup trucks → less demand for Ford advertising → less demand for advertising workers etc.
This chain of events takes ~7-8 quarters to unfold. Then the upcyle returns

US Housing as well as Consumer Durables demand turned south around April ‘22. This means we are in the early innings of the downturn
Now, the Billion-Dollar question is - How severe will the downturn be? Let’s look at the data to find an answer
First, Housing:
The NAHB US homebuilder survey has lead character for housing activity over the next year. It is falling off a cliff2
Second, Consumer Durables:
To judge future Consumer Durables demand, we can use the manufacturing business surveys by the Regional branches of the Fed. Taking the Philly Fed survey, again, new business expectations are falling off a cliff
But it is not only a decline in Housing and Consumer Durables that weighs on the economy
Businesses and consumers have also been steamrolled by higher commodity prices
Accordingly, they adjust their future plans. Consumers trade down and cancel holidays, businesses cut capex and lay off staff. Again - this process evolves with a time lag. It reduces future demand, making a recession more likely (see chart below with recessions preceded by commodity price spikes)
Summary: The Economic Cycle is likely in the early innings of a slowdown, and that slowdown will likely be severe
Now, let’s move on to the topic of this post - Liquidity. Or, in other words, the evolution of the amount and availability of Money
Broadly, there are three drivers of Liquidity. (1) Central Banks (2) Private Sector Credit and (3) Risk Sentiment
First - Central Banks
Central Banks control short term interest rates and set them to their (unfortunately very often misguided) views of the economy
With a ~12-18 month lag, these changes arrive in the real economy, as businesses adjust their budget plans accordingly
There is a more immediate effect on Housing via the cost of mortgages
With regards to interest rates, the past six months have seen unprecedented tightening by global central banks. Accordingly, economic activity should slow considerably
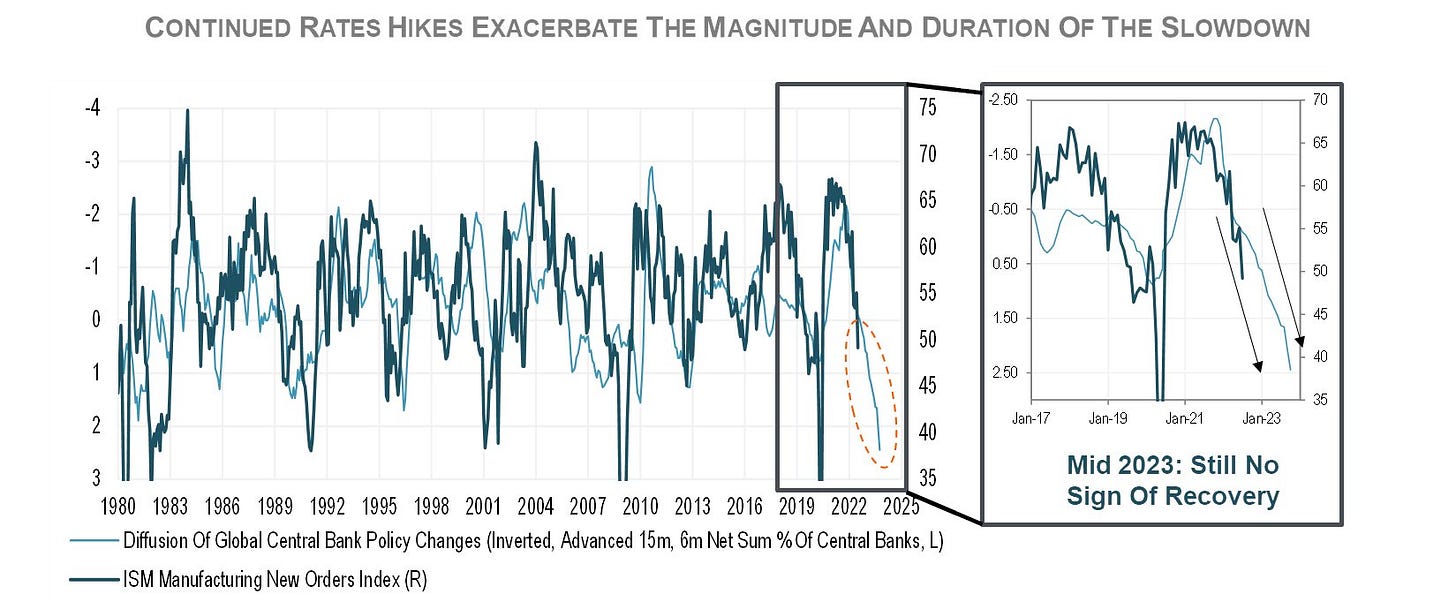
I’ve taken the below chart from the great Michael Kantrowitz from Piper Sandler, whose work I wholeheartedly recommend. It correlates the ISM New Orders index with global central bank activity, with a 15-month lag. It implies new orders will head much lower

Over the past decade, Central Banks have introduced another powerful lever to influence Liquidity - their balance sheet
My readers will be well familiar with the practise of Quantitative Easing (QE) i.e. Central Banks buying government and mortgage bonds to stimulate consumer demand via the “wealth effect” (i.e. consumer that own assets would spend more as these assets go up in value). This added trillions of USD, EUR and JPY to the respective balance sheets
The mirror image, Quantitative Tightening (QT), is currently underway to shrink the Fed’s balance sheet, rolling off ~up to $95bn in USTs and MBS per month
However, the Fed’s balance sheet antics have evolved much beyond QE and QT
As COVID-19 emergency measures added $4.5tr to the Fed’s balance sheet within a few months in 2020, the role of the Treasury General Account (TGA) and the Reverse Repo facility (RRP) have now eclipsed the role of QT, with the latter swelling to $2.5tr (!). Both remove Liquidity, e.g. if the Treasury collects taxes from the private sector, these are removed from circulation until the Treasury spends them again
Via both channels, >$1tr in liquidity has been removed YTD, dwarfing QT by a mile and likely contributing to the equity market decline over the same period. The chart below shows “US Liquidity” as the size of the Fed Balance sheet, reduced by the TGA and the RRP, you can see how it closely tracks the performance of the S&P 500
Summary: Central bank liquidity is aggressively contracting
Second - Private Sector Credit
Businesses and individuals can seek Liquidity by applying for credit at banks or private credit vehicles (hedge funds, direct lenders etc, often summarised as “Shadow Banking”)
These lenders will decide on these requests by (1) judging the risk of default and (2) assessing their own capital position and thus ability to lend
As a lesson from the 2008 Financial Crisis banks today are well capitalised. However, Bank and Shadow Bank executives read the news just like we do, and given the difficult outlook have raised lending standards - it has become significantly more difficult to obtain credit (see data for Europe below)

This is also echoed in some large-scale headlines, e.g. the difficulties around the financing of Elliot’s Citrix $20bn Mega-LBO. Tellingly, US net high yield issuance has contracted in the last quarter, i.e. more credit was repaid than newly extended

Summary: Private sector credit is contracting
Third - Risk Sentiment
The third driver of Liquidity encompasses global Risk Sentiment, i.e. the propensity of anyone with money to spend or invest it and thus and provide liquidity to those who demand it
This is arguably a complex metric to derive, however, the treasury bond markets provide valuable insight on this matter
On the one hand, treasury bonds are very boring, they don’t have a “story” like, say, growth stocks a la Tesla or Peloton. On the other hand, they are extremely liquid and their many derivatives can be arbitraged against each other (e.g. inflation-linked vs no inflation, 5-year vs 10-year etc.), providing unique insight into collective market views
Decomposed into individual components, they provide the markets’ current read on (1) inflation expectations (2) interest rate expectations and (3) term premia
And it is Term Premia what we are after
The Term Premium refers to the additional interest the issuer needs to pay to compensate for the longer duration. It should be more expensive to hold a 10-year bond than a sequence of ten 12-month T-bills, as the latter provides more flexibility
Accordingly, Term Premia should be positive. However after a brief moment in positive territory in April 2021 they are now again deeply negative and trending lower

Ok, but what does that have to do with Risk Sentiment?
Let’s recall that the short end of treasury bonds (1-5 years) is influenced by what the Fed decides on today’s interest rates
The long end however is mostly influenced by safe haven demand. Long term bonds are the “risk-free” yield-bearing asset. If you are worried about the future, as good as cash, but with interest
The Term Premium indicates how strong the safe haven demand is. And right now, it is very, very strong = Risk sentiment is low, everyone is hoarding Liquidity
In a mind-bending way, as the Fed conducts QT and rolls off US Treasury bonds, long end yields DECLINE, instead of going up
Why? QT removes liquidity → more economic stress → more demand for safe haven assets
Conversely, when the Fed conducted QE, long-term UST yields increased and the curved steepened. However, as a second order effect, the excess liquidity provoked more debt issuance, which in turn required lower rates to prevent default
We can measure Risk Sentiment also in another safe haven channel - the US Dollar
Ask yourself, which large, liquid currency would you want to own, if you expect turmoil on the horizon? The Euro, the Pound or the Chinese Renminbi? → This is why the US Dollar has appreciated so much
Conclusion: Whether it is Central Bank Liquidity, Private Sector Credit or Risk Sentiment, all Liquidity drivers are currently tracking very poorly
Ok, the economic cycle is deteriorating and liquidity is evaporating - surely a great time for the mighty Fed to step in and crank-up the money printer again?
Not so fast… there is still inflation!
But in your last post you said inflation has peaked?
Not so fast… just because inflation has peaked doesn’t mean the problem is gone!
Let’s briefly check in on inflation:
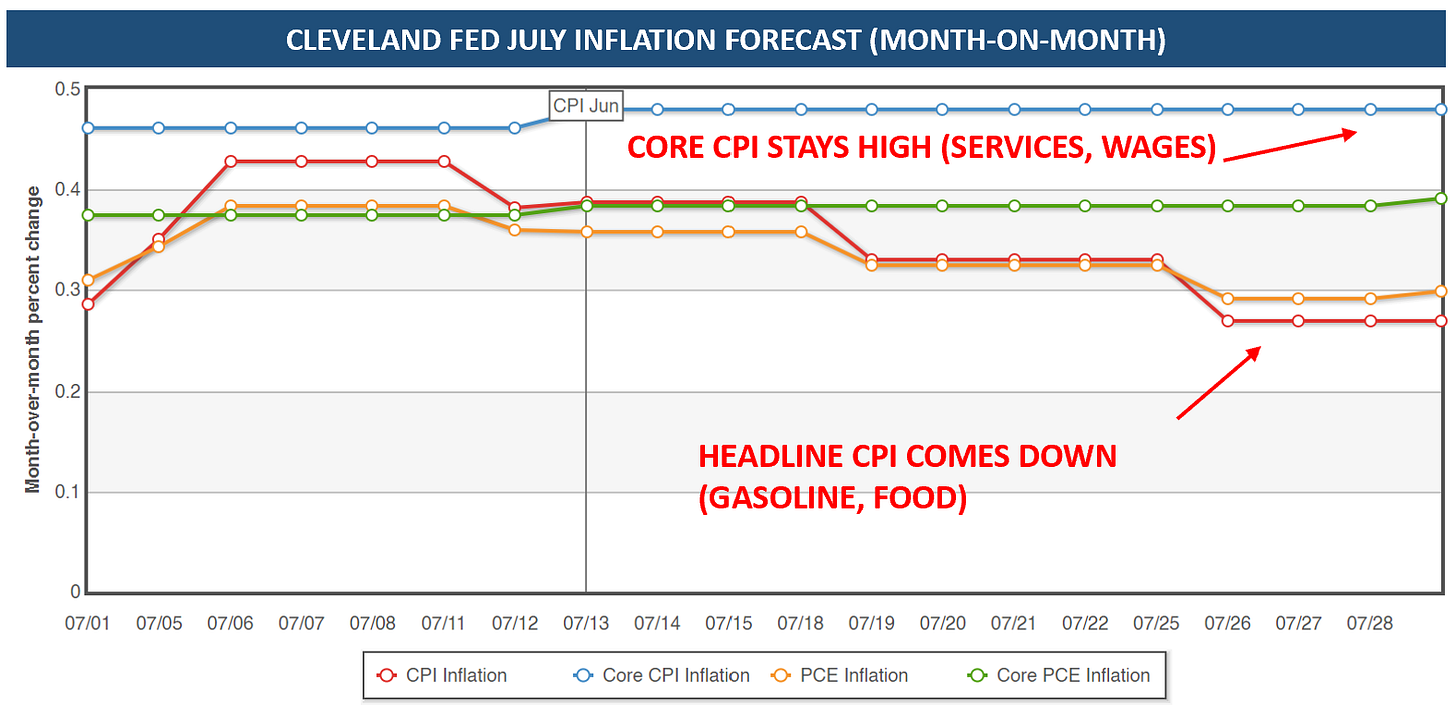
Yes, headline inflation will very likely come down significantly with the July CPI print (est 0.29% m-o-m vs 1.1% m-o-m June). This is what I predicted in the last post, and what contributed to the rally in bonds
However, the underlying causes for inflation are still very entrenched, and therefore the issue of inflation is far from over
Regular readers will be familiar with my focus on the price-wage spiral as early as December 2021. These pressures persist, and will likely show in a meaningful divergence between Core CPI (driven by services and wages) and Headline CPI (driven by gasoline and food). See below the current July CPI Cleveland Fed estimates
But even headline inflation is only coming down BECAUSE the Fed is so aggressive
The moment the Fed relents, risk sentiment turns around and drives up prices via the asset price channel (e.g. commodities, real estate, stocks). We witnessed that with the massive “everything” rally post the last FOMC, which had a dovish tone to it
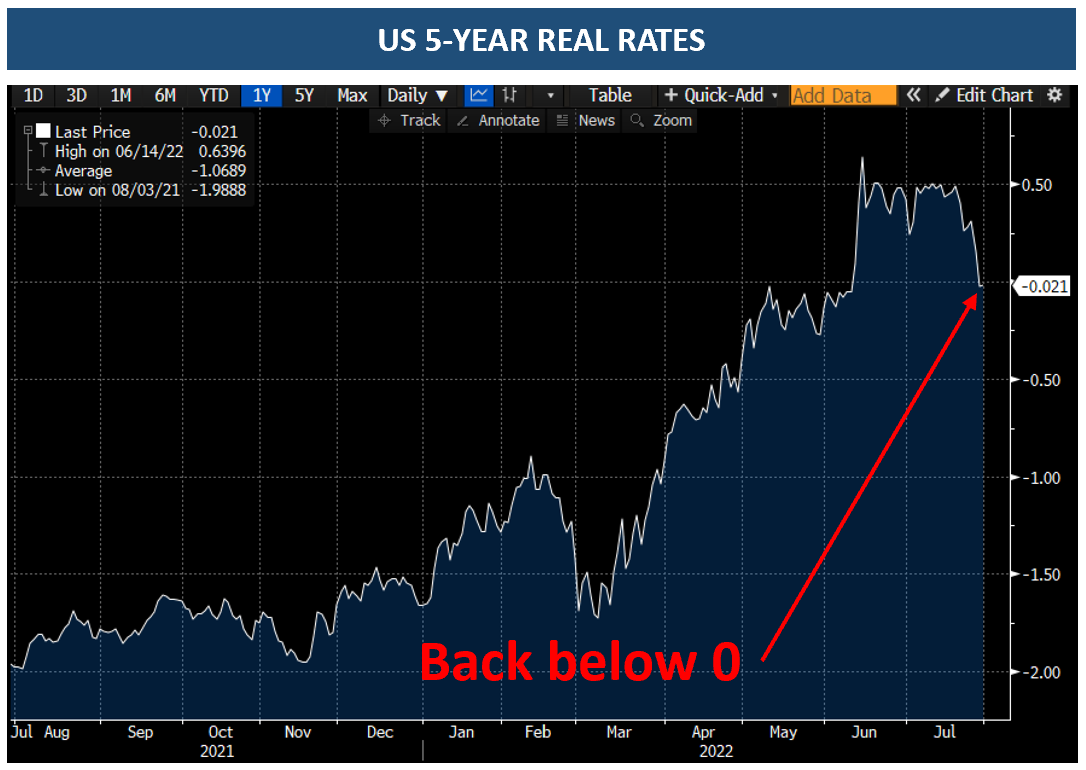
As a consequence, the market pushed real interest rates again below zero, into inflation-feeding territory. This provided the ammunition for all other assets to rally
So we know the economy is on a poor path, liquidity is on a poor path, but inflation remains an issue. Over the next few months, the market will come to realise a painful PARADOX, in my view:
If the Fed raises interest rates high enough to combat inflation, it likely crashes the world economy, which is already on the ropes
If the Fed relents, an economic crash may be avoided, but we immediately return to inflation, likely even worse than before
This is exacerbated by the tremendous amount of global debt. However, it is important that the debt issues are OUTSIDE the US private sector. As a reminder, below the chart of US Private Sector “Net Debt”, with M2 as a proxy for private sector cash3
Also, in my view, US unemployment will likely only rise slowly given how understaffed many sectors still are. This changes the Fed’s sensitivity and the timing of any pivot, while the rest of the world crashes
A pivot will likely come (late ‘22/early ‘23?), but given the discussed ~15 month time lag, a huge amount of damage may already be underway - again likely mostly outside the US
What does this mean for markets?
As always, I try to connect the dots with common sense, acknowledging that the future is highly uncertain and that I may often be wrong
To summarise this post: Liquidity will remain a headwind as long as inflation isn’t defeated. The economy will slow hard and likely trough in mind/end 2023. Historically, the market turned 4 months before the economy

This leads me to the following conclusions:
Equities - After running a reduced short book (see last post), as per last Friday I’ve now fully scaled back into equity shorts again (see Twitter for near-time updates). US indexes have rallied ~15% of their lows and FOMO is creeping back in - in late July, Retail has been buying the most Tech since 2014. Tech earnings, contrary to reporting, were not good (Apple +2% nominal revenue growth, Google flat EBIT), while they still included the strong April and May (for excellent Tech earnings summaries, please see Wasteland Capital).
Generally, I believe the Nasdaq is hiding much more cyclicality than commonly assumed. This, together with said signs of “FOMO”, is why the bulk of my shorts are once again with the Nasdaq (QQQ), but for obvious reasons also include cyclicals (e.g. IWM, JETS, DAX, SX7P). Further, I believe the last explosive leg of the rally is driven by lower real rates (not lower LT bond yields), and I expect the Fed to talk these up again, as Neel Kashkari did over the weekend. Finally, can this rally go higher? Yes. Do I know when it turns? No. So I’ve sized the position accordingly and accepted the risk of a much higher squeeze
Bonds - Long term US treasuries via TLT and ZROZ remain my largest position, even though they are currently technically overbought, so I am watching them closely. I expect the Fed to push back against inflation, deeply inverting the curve as happened in 1981, as short end yields go up on Fed rhetoric and long end yields go down on safe haven demand, at the very least on a relative basis. I also deem the risk of “accidents” significant (i.e. credit events with unknown second order effects), in which case demand for long-term treasuries would increase significantly. Long term bond yields likely rise beyond a technical correction if either (1) the next cyclical upturn is in sight or (2) the Fed has lost inflation credibility e.g. via a premature pivot
Credit/Distressed Debt - I have seen the various calls for deploying capital in distressed debt, e.g. by Howard Marks. However, the synthesis of this post leads me to believe that we have not seen the peak in credit spreads, and another, bigger round is likely in the making. Keep in mind, none of this is investment advice, I may be wrong, this is as always my personal connecting the dots as I see them
Commodities - I very much acknowledge the tight supply especially in oil and coal, as well as poor sentiment more broadly that could further squeeze commodity prices in the short run. Beyond that, the cyclical headwinds are enormous. Because of these crosscurrents, I currently have no position here
Finally, there will likely be a moment when the Fed “pivots” as the world economy would otherwise go into the abyss, with mass defaults
There is $300tr global debt, assuming an average maturity 5-year maturity = $60bn refinance need p.a., again with the issues likely, mostly abroad. When the “pivot” moment is near, the obvious choice is GOLD, BITCOIN and COMMODITIES, and to sell US Treasuries. But, in my view, we are not there yet, and the path to it remains highly uncertain
Please also keep in mind that the political consequences from another “QE-firehose” are significant and unpredictable, just as much as Central Banks are always keen to avoid the mistakes of the last war. The outcome could be different next time around
I hope you enjoyed today’s Next Economy post. If you do, please share it, it would make my day!
Please see more details in “Consumer Cycle, Not Business Cycle”
This ignores the enormous divergences between wealth brackets, with the bottom two quartiles under much more financial stress


Superb work.. One of the most thoughtful piece of analysis i've read. Thank you for sharing