
Summer is Over
Why yesterday's US inflation data is a gamechanger for financial markets

In early June, I wrote a piece on inflation called “From Hot to Cold in 90 Days” describing how US headline inflation would drop to zero in the coming months. This was correct - headline inflation was flat both for July and August. I followed up with two further posts “The Mean Core” and “Is Inflation Over?”, predicting that core inflation would remain problematic and that markets would be haunted again by the inflation ghost in the Fall
Yesterday’s US CPI data confirmed said hypothesis. Yes, headline inflation was flat, but core inflation came in much worse than expected - it was a shocker number
Many aspects of my research are coming together in this moment. In a piece a few weeks ago called “Capital vs Labor, Pt 2” I wrote how a tight labor market would lead to higher inflation for longer. We see confirmation in the strong services inflation, driven by higher wages. More recently in “Quantitative Frightening” I predicted a new high for US Treasury yields, with enormous consequences for the global financial system. We have now blown way past the previous highs for the US 30-Year bond, and are close for the 10-Year
I follow a data-dependent approach, and yesterday’s CPI print was a big datapoint that will reverberate through markets for a while. Today’s post lays out why
As always, it closes with an outlook on current markets, where I explain why I reverted back to short equities after the release was published, after a very brief interlude on the long side. I shared this and much of the data driving my approach real-time on Twitter
So let’s dive in.
At first glance, the CPI release seemed good. Headline inflation was flat, and the White House gave a press conference lauding the success of its anit-inflation initiatives
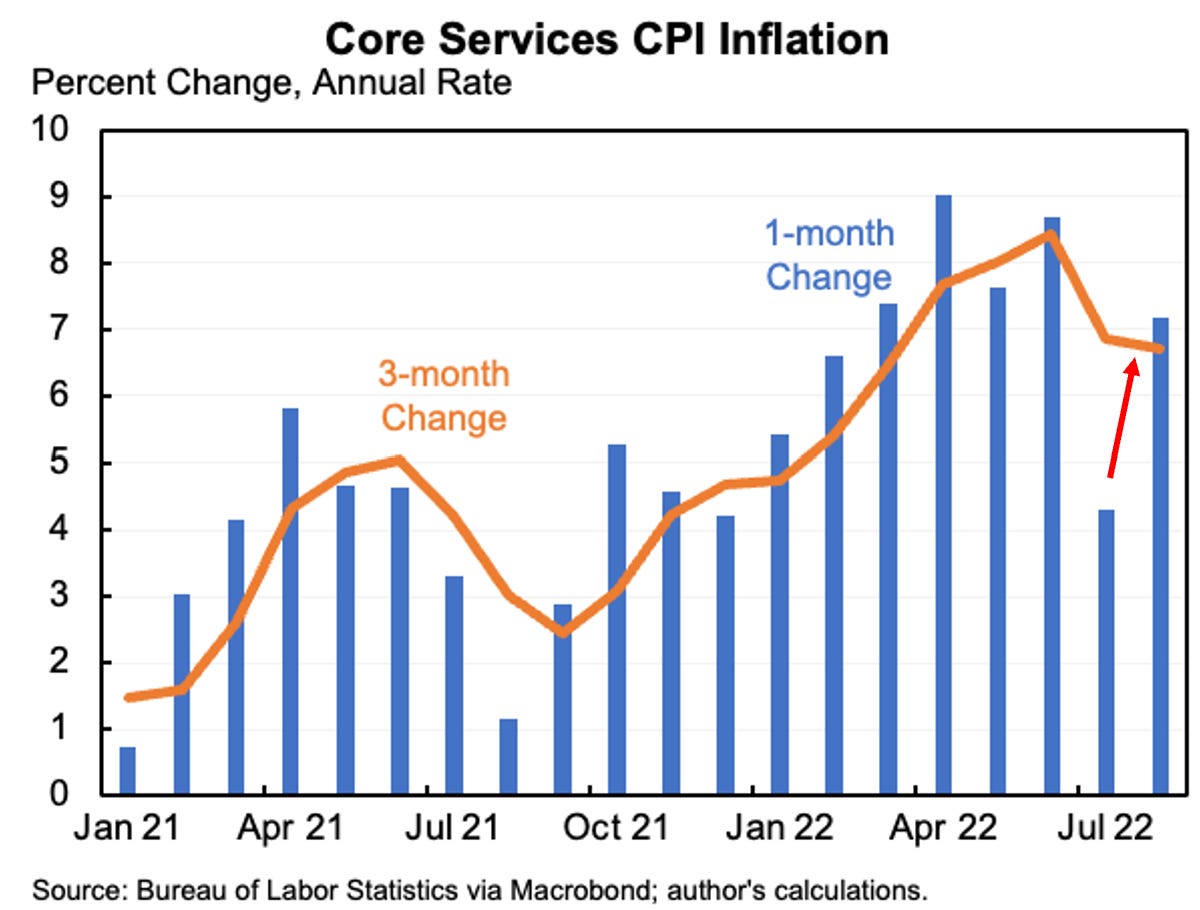
But that was the headline, and it was dragged down by lower gasoline prices. The core inflation number, which excludes volatile energy and food, came in at 0.6%, or ~7% annualised
This was much higher than expected, and entirely driven by wage-sensitive services categories including rent (+0.7%), food away from home (+0.9%), medical care (+0.8%), personal care (+0.7%), education (+0.5%) and car insurance (+1.3%)
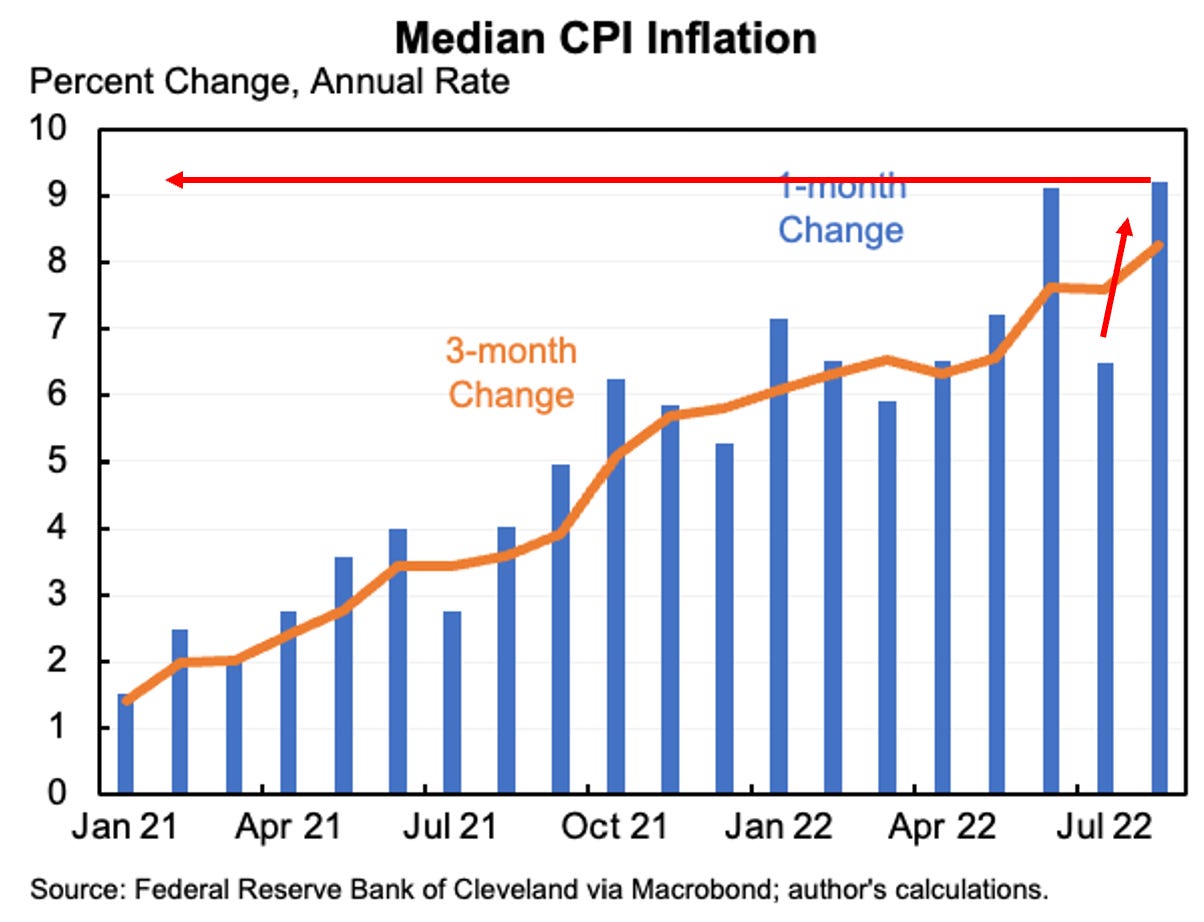
Problematically, the increase was broad and “sticky”. This is reflected in the Median CPI, which reduces the weight of outliers to the up- or downside - it reached its highest ever reading (!)
Another way to judge the broadness is to measure the share of items running at >6% annualised inflation. It rose to a cycle high of ~70%

Summary: US August inflation indicates substantial inflationary pressures, with some measures at cycle highs. Little progress has been made to achieve a cooling-off
Now, what is the reason for inflation’s rapid comeback? Financial markets priced its demise with increasing certainty, with US 1-Year inflation expectations at 1.7% as recently as last week?
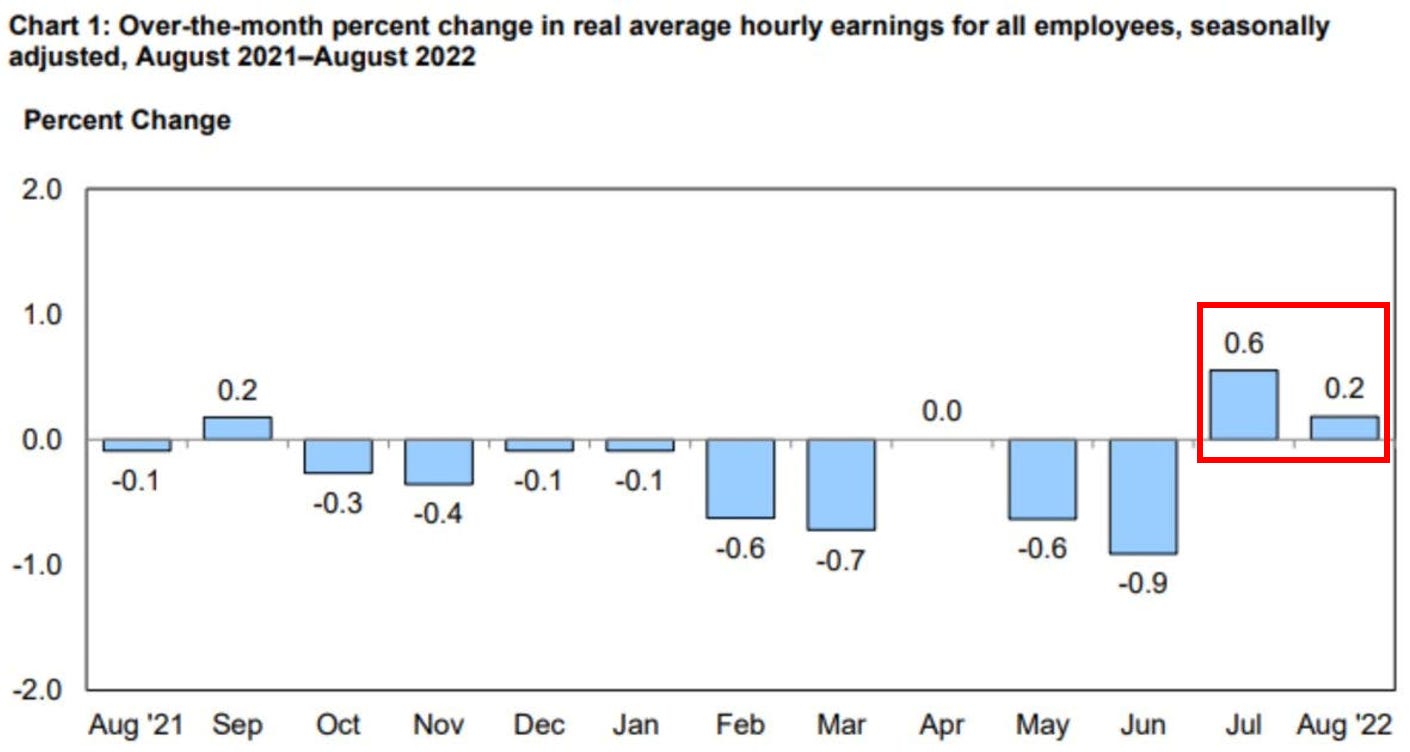
Regular readers may recall how I laid out that the same lower gasoline prices that drove down headline inflation provided a boost to US consumer wallets
This would create a yo-yo effect, where the money saved on gasoline is simply spent elsewhere
Indeed, August was another month with rising real incomes. In response, Americans spent more, which we already knew from near-term data (e.g. BEA credit card spend or withheld payroll taxes, which are both provided weekly)
The improved economic activity also immediately translated into the US labor market. Its overheated state is the origin for services inflation, and the now much discussed price-wage spiral. Let’s look at two near-time data points:
Indeed job postings, a good near-time proxy for the official JOLTS job openings data, increased in the past weeks and remain on very elevated level. Unretirement is down, jobseekers find new jobs very quickly

Similarly, initial jobless claims, another good quality weekly series, trended down again and remain at historically low levels

The labor market remains extremely hot, driven by three factors (more details in this post):
First- the demographic cliff. Baby boomers retire, but continue to consume. Their roles are filled with a narrower, less experienced demographic, resulting in a shortage of skilled workers in many OECD countries

Second- deglobalisation. Geopolitical tensions force Western companies to bring production back from abroad, in particular China, e.g. Intel’s announcement to invest $100bn in a new Ohio chip plant

Third- lower immigration. Political currents have changed and today, immigration is unpopular on either side of the isle

It is not only the labor market that pushes inflation up. After COVID-19, US households were flooded with cash. So far, only the lowest quintile used it up
I’ve shown the chart with household cash balances a few times before. Below is another way to look at it: Most Americans own homes, and as home prices went up and mortgages were refinanced at low rates, today their mortgage leverage sits at levels as low as the mid 1980s

Summary: The structural reasons for high US inflation remain very strong. It likely requires extraordinarily strong measures to break them
August’s inflation data confirms what history has frequently shown - inflation is easy to conjure, and very hard to get rid off
I wrote a piece back in early June on US interest rates saying “3% is not enough”. This was accurate. The Fed now needs to be more aggressive for longer. Its two main tools are (1) higher interest rates and (2) balance sheet reduction, also know as “Quantitative Tightening” or “QT”
This is where the US inflation issue becomes a global financial system issue
Higher US bond yields drive the US Dollar higher, especially against the Japanese Yen and Chinese Renminbi, but also Europe, where debt levels are much higher and thus Central Banks on a different, more dovish trajectory

Foreigners own ~30% of US treasuries, with Japan and China on top of the list
A weaker Yen and likely devalued Renminbi (it is currently fixed to the US Dollar) reduce their purchasing power - it will be harder for them to buy Treasuries at the historical pace

This leaves aside the question whether China would want to keep buying its geopolitical adversaries’ debt, thereby funding various US anti-Chinese initiatives, from reshoring to rearmament
High US yields create enormous tension everywhere, but the situation is particularly acute in Japan
Japan is import-dependent for its food and energy. I’ve discussed high food inflation last week, and much of Japan’s energy imports are in form of LNG and coal, which the European energy crunch has made more expensive.
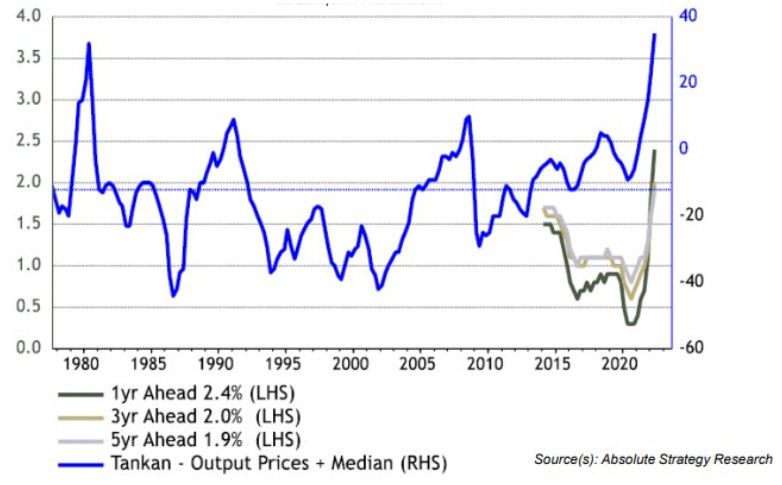
High US bond yields have weakened the Yen by 23% since the start of the year, so these imports are now a lot more costly. As a consequence, Japanese output prices are now as high last in 1980
If the BOJ increases rates to stop the Yen from sliding, it blows up the country’s debt pile. If it does nothing, it imports inflation into the world’s most inflation-averse society, where wage increases are an abnormality
Aside from higher interest rates, the Fed fights inflation by rolling-off the US debt it owns - in other words, QT
The Fed owns ~25% of all US government debt. With QT, the biggest individual owner of US Treasuries retreats from the market.
As a result, liquidity in treasury markets dried up, a strong sign that, by now, this market does not function properly without the Fed’s participation
Low liquidity makes treasury markets vulnerable to shocks and extreme moves in yields. Should yields spike up for whatever reason, the Fed might have to intervene by providing liquidity (i.e. QE) to guarantee an orderly market
NB: This is even worse in Japan (not shown in chart below), where the BOJ owns >50% of all debt outstanding and sometimes days pass without a trade

Summary: Over the past twelve years, the Fed bought ~$8tr of US government debt. This unprecedent balance sheet expansion provided the world with the liquidity to lever up, from German mortgage debt to Italian government debt to Japanese corporate debt
The Fed now needs to unwind this expansion to fight persistent US inflation
This unwind wrecks havoc in Asian and European capital markets and hammers local currencies, which decimates foreigners’ ability to buy US Treasuries
Into this fragile market, over the next few years, the US government intends to issue new debt at an annual pace of ~$1.5tr, compared to $0.5tr pre-COVID
How is this going to work?
Conclusion:
To tame inflation, the very hot US labor market needs to be broken
Looking at estimates frequently stated by Larry Summers, or in this recent paper by Larry Ball, the unemployment rate needs to be driven above 6.5% and stay there for an extended period of time
Given high US consumer cash balances (except the lowest quintile), the persistently high inflation data and historical precedent, I find these estimates plausible
The structural changes to the labor market (demographic cliff, deglobalisation, lower immigration) suggest it requires very forceful central bank action to achieve this
This needed, very forceful central bank reaction is likely too much for global financial markets to digest
Higher US yields increase the likelihood of an FX crisis in Asia and a global buyers’ strike for US treasuries, with severe negative implications for all assets
While unemployment may be slow to increase, corporate profitability likely suffers much faster. This would decimate US tax revenues, thereby increasing an already high deficit, which pushes US bond yields up further
More so, several years of high unemployment are a huge political challenge in an already toxic climate
Americans are angry, and political mistrust is near an all-time high. The US has no safety-net for unemployment, millions of American would be miserable. Will they tolerate a deep recession with high unemployment?
Please note: The reason why Paul Volcker could be so radical in his 1980s inflation fight and drive up unemployment up to 10%, was because after a decade of high inflation the US public was ready for it
I believe US inflation, global debt and political pressures all run on vectors that drift apart. Something will have to give
My base case, that has further been affirmed by yesterday’s inflation data, remains that the tension between inflation and capital markets remains unsolvable. Eventually, the Fed will have to provide liquidity to markets again, either by restarting QE, or by a closet variant of it (RRP rate cut, SPR reform, Treasury Buybacks etc). This will likely proof inflationary
Accordingly, this will likely be justified with a higher inflation target, for which the academic chorus grows by the day
Please note: This is not a judgement on this path being right or wrong. I simply see it as the most likely. Either way-
It will also be the moment when to buy, as this eventual pivot likely increases all asset prices
What does this mean for markets?
As always, below is my personal attempt at connecting-the-dots for my own investments. Please keep in mind - I may be totally wrong, nothing is more important than risk management, and none of this is investment advice
As a regular reader you will be familiar with my bearish views for the majority of this year. I follow a data-dependent approach, it is what the data told me for most of this year
As outlined in the latest post, I recently covered shorts and went into the CPI release almost entirely in cash, aside from a short in German Schatz futures (discussed here) and a 1% call-option on ARK as a proxy for US high-growth Tech, which would likely have seen a sharp rally in case of in-line inflation data, given the negative equity positioning
While it is - in my view - possible to call broad trends, individual datapoints are unpredictable. 50 economists submitted an estimate for yesterday’s CPI print, only 3 (!) got it right. This is not because they are stupid, it is because the randomness in a single print is simply way too high
Once the data is out, broad trends are reaffirmed, sometimes in a dramatic way as was the case yesterday
For that reason, after the print, I resumed my bearish stance and loaded up on equity shorts, with a particular emphasis on rate-sensitive sectors (e.g Nasdaq-100/QQQ, Homebuilders/XHB, the US 30-Year mortgage hit a cycle high of 6.3% yesterday)
Amidst an economy bound to slow well into 2023, an expensive equity valuation vis-a-vis bond yields and QT looming large from the 15th September, when USTs are repaid, slower inflation was the one hope equities had
This got crushed, and now the divergence between bond yields and equities needs to resolve, likely by declining equities

Applying a simple fair value model with 3.4% US 10-Year Yields, a 3% Equity Risk Premium (which is historical average) and a current ~230 EPS puts the S&P 500 fair value at 3600. I think EPS goes lower in 2023, likely >200, and yield may yet reach higher
On Europe, my thoughts are as follows
I continue to maintain that markets underestimate the impact of the European energy crisis, especially on corporate profitability. As the demographic cliff is particularly pronounced in Europe, unemployment may rise less than expected and GDP might even fall less than worst case scenarios, with corporate profitability the balancing valve. Profit warning are coming in fast now, e.g. from Thule, Kion, FL Smidth, RTX or Electrolux. I am again short DAX and SXNP (Industrials)
Electrolux is of particular interest given it sells washing machines, i.e. housing-related, expensive consumer-discretionary goods. Below a snapshot from its 2Q earnings - organic sales are flat, and EBIT is down 72%, as costs crush the PnL

In “Capital vs Labor, Pt 2” I introduced the concept of profit recession > employment recession, this is a good illustration. Further, in “Consumer Cycle, not Business Cycle” I laid out how recessions emanate from housing and consumer durables. Electrolux’ profits are under pressure, so it will now cut costs across the board, from software to business travel. This is one avenue how a downturn in housing eventually arrives in the broader economy
Beyond trading or market shorts, the question I am most frequently asked is - When do I buy? And what do I do with my cash? Below are my answers
First, please bear in mind, these are just my two cents, always do your own work, and this is not investment advice!
In my view, we currently experience consumer price inflation and asset price deflation. Cash held for investment purposes does NOT lose value in such a context. From the 1st of January ‘22, money held in cash fared much better than money put into the stock market, bonds, US housing, German housing or practically any other assets class. We are witnessing the unwind of a giant “everything bubble”
I continue to find cash the best “non-trading” alternative, as I also believe corporate debt spreads are likely to still increase and US bond yields (ie long term government debt) still to go higher. More so, this cash is now getting paid. US 1-Year rates are at 3.9%, and US inflation expectations for the same period (rightly or wrongly) are at 2.2%
In my view, the moment to buy pretty much anything is before the Fed pauses and/or provides liquidity again. Before yesterday’s data, I thought this moment to come maybe even towards the end of the year. I now believe it to be further out
I hope you enjoyed today’s Next Economy post. If you do, please share it, it would make my day!
Absolute pleasure to read.. i find myself going over it again and again.. When you refer to owning cash cash, are you referring to going long very short paper, one year maturity ? US-1-YEAR rates@ 3.9% ?Also, can one reconcile a core CPI north of 6, and US inflation expectations for the one year period of 2.2%?
Beautiful analysis.
Question: why do you think treasury liquidity is going to be an issue given reverse repo and Fed swap lines?