
The Most Important Chart for Markets
And why it has nothing to do with economics, and all with politics

I wish all my readers and their families a Happy New Year 2023, and hope everyone enjoyed the Holidays. In financial markets, US Treasury bonds, which I discussed as key ‘23 investment in my last post, had a great start to the New Year, with both long-term nominal bonds (TLT) as well as TIPS up 6-7%. With incremental data, markets are coming around to the view of slowing inflation, something I had already discussed last year in “A Frugal Christmas” and “Is Inflation Over? Pt. 2”
As I assign a high likelihood to - temporarily - lower inflation as well as a hard landing for the US economy, the central question is - how will the Fed react? We find the answer in what I think to be “the most important chart for markets”. It has little to do with economics or finance, and all with politics
This post walks through the reasoning and what might be in store this year. As always, it closes with an outlook on current markets
To dive in, let’s start with inflation. After two years of very high CPI prints and some significant structural changes in geopolitics and demographics, why is it now on the way down, and fast?
The short answer is the Fed. Its policies, from QT to the RRP and rate hikes, successfully prevented the enormous excess cash created over COVID-19 to multiply further through the economy
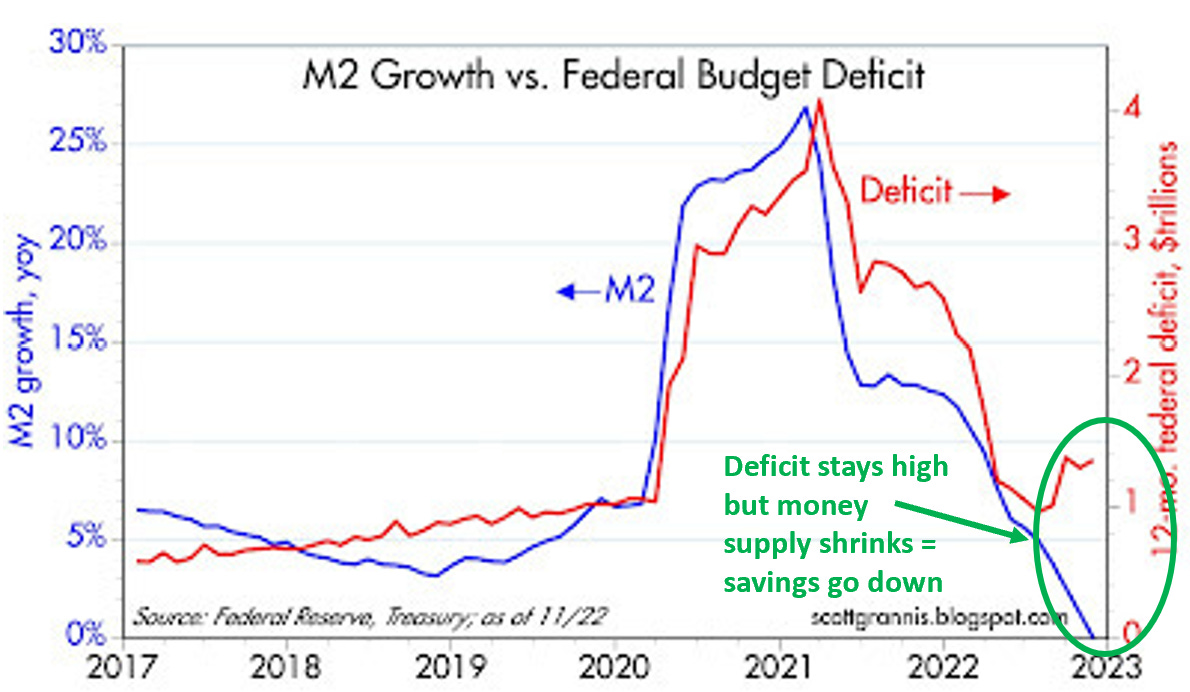
We can see this in money supply metrics such as M2, which in an historical anomaly is contracting. Simplified, if “money” does not grow, it is hard to see higher prices

With enormous monetary policy headwinds, the $2.5tr stock of excess consumer savings melts away (it is part of M2 via deposits)
At the current pace, it will be entirely depleted by mid to late ‘23. Inflation would likely be much more persistent if this stock of savings increased, or at the very least were maintained

Now, where do the savings go? After all, if I spend $1000 on a new TV, someone else receives my $1000, so the aggregate saving stock should remain the same. But it isn’t. The answer is two-fold:
First, the US is a huge goods importer, so part of the savings simply went abroad
Second, while M2 Money supply is in decline, government deficits continue to run on very elevated levels. So much of the money goes to funding the US Treasury deficit. The green circle in the chart below illustrates this well
So, for now, no new money = no more inflation. But what about some very pressing inflationary drivers such as wage growth, or China’s re-open?
Wage growth indeed is crucial to maintain inflation. And yes, even if money supply (and with it deposits) decline, inflation can be generated by redistributing existing deposits, e.g. by moving money from corporate accounts to consumer accounts
However, we all know that corporates do not like that at all. They respond to lack of growth and higher input costs (i.e. lower margins for them) with cost savings measures. These typically include layoffs. As laid out in the next section of this post, there are now strong signs that US unemployment goes up within the next 1-2 quarters, which likely reduces wage growth going forward
Let’s move on to China’s reopen, where the country has given up on Zero-Covid in a rapid U-Turn. Indeed, a meaningful demand boost is to be expected from the Middle Kingdom, for two reasons:
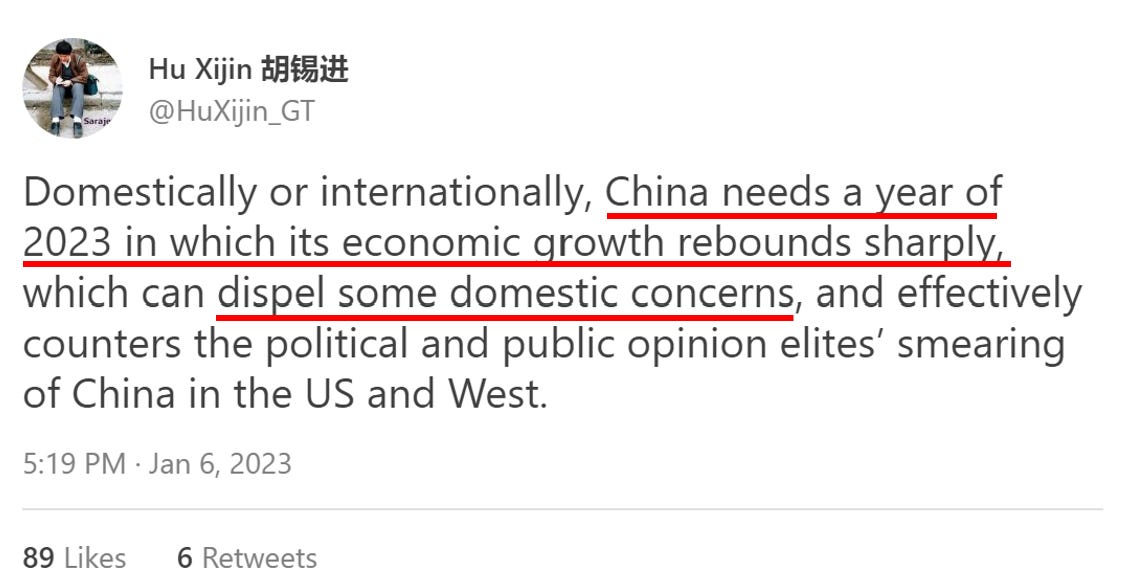
First, strong economic growth is the best way to console its populace over a very painful three zero-Covid years, with a pretty botched ending. Global Times editor and government mouthpiece Hu Xijin confirms this perspective
Second, especially last year, the locked-at-home Chinese consumer built significant excess savings (RMB6-8tr/US$700-1100bn). There is likely just as much enthusiasm about spending as in the West after the US and Europe reopened in 2021

As a result, demand for anything China-related, from Macao Casinos to Copper or Luxury Handbags likely increases. However, in a globally interconnected world this effect likely eventually finds its limits:
The world economy is based on the US dollar, most global debt is US-Dollar denominated and the global supply of US Dollars continues to contract. China as the world’s largest exporter won’t be immune to that
Further, its real estate bubble has been pushed to an extreme extent, with absurd valuations and 20% vacancy rates in residential property. It seems hard to see another bubble blown on top of that
For both the path of inflation and Federal Reserve policy, the evolution of unemployment is key. Unemployment in turn is a function of the intensity of the economic cycle. As laid out in previous posts, the probability of a “hard landing” is high
As discussed, in the next 6 months, many US consumers likely run out of excess savings. At the same time, corporate profits are under intense pressure from higher financing costs as well as other input costs (labor, commodities), which take 12-18 months to feed into the real economy
Below, a simple correlation is one of many ways to look at this. ISM Manufacturing New Orders have fallen off a cliff. With a 10 month lag, this decline in future corporate activity shows up in S&P profit margins, which are bound to decline considerably from here

With pressure on profit margins, corporates will look for ways to cut costs. Unfortunately, this frequently includes layoffs. Looking at lead indicators for unemployment, the trend is clear:
The number of temporary help workers just turned negative on a year-on-year comparison. The correlation to unemployment is obvious: Temps are the first to be let go, with permanent staff to follow later

The picture is similar when looking at how much time workers spend on the job, below for manufacturing industries, which lead economic activity. Hours are down sharply from recent highs, and will likely trend lower from here

Finally, I frequently mention the ratio of vacancies to unemployed and how it remains an open question whether it will affect the evolution of unemployment
Digging deeper, it turns out almost all excess vacancies are at small companies. These are much more vulnerable to a downturn, as they lack the resources and scale of larger firms. This suggests vacancies could decline relatively fast as the economy deteriorates

Summary: It is likely that US economic growth slows considerably in 2023, accompanied by meaningful increases in unemployment
Now, lower nominal economic growth and higher unemployment are never good, but they create intense difficulties when high leverage is involved
I’ve discussed the pain in store for levered loans in “Incentives & Inequality”. However, government finances really move into the flashlight here, as tax revenues tail off with lower nominal growth, while the cost of entitlement programs shoots up
Looking at projections for the US government deficit and debt load, issued by the Congressional Budget Office, we notice that even without a recession the numbers look extremely challenging

At some point this year (data points to Q2), the US economy likely slows hard and unemployment goes up. This would put intense strain on government finances. At that point, the Fed will need to decide between two choices:
Stay hawkish and force the government to balance its budget via austerity, i.e. cuts to entitlement, defence and its energy transition agenda
Pivot to a supportive monetary policy that allows the government to maintain or even expand all these programs, at the expense of seeing inflation return
The answer is highly political, and it can be found in the chart below - in my view - the “most important chart”, the title of today’s post
Traditionally, voter intentions have moved in step with life. At the onset, the majority of a generation is left of center, following the youthful idealism and dreams of a fairer society
Into adult life & beyond, many voters then move right of center, as thoughts turn inward to family and stability, and there may be disillusionment with grand societal concepts
With Millennials, however, something very different is happening. As this generation gets older, voting intentions are moving further left of center:

Why is this so important?
Millennials are bound to shape policy decisions for the coming decade, and it is very clear they are in favor of more state intervention and more government support, and firmly against more austerity
Their views find reflection in the programs of all political parties, not just of those on the left. Just think of Trump’s stimulus cheques at the onset of Covid, Rishi Sunak’s tax hikes or Angela Merkel’s decision to exit Nuclear power, all decisions made by conservative politicians
We’ve already seen Millennials decide an election. At the midterms, the Democrats gained a Senate seat (while the sitting President’s party typically loses at this point in the term), and this in spite of economic turmoil and low approval ratings, something last seen 70 years ago under FDR
So which path will the Fed choose? Financial markets follow central banks, central banks follow politics, and politics follows public opinion
As such, I expect the Fed to turn dovish very soon after unemployment rises, in response to intense political pressure, and supply markets with liquidity once again, with higher subsequent inflation to follow
Now, the question is, why are Millennials acting so differently to prior generations? In my view, the answer is simple:
Millennials spent most of their professional lives in the aftermath of the Great Financial Crisis
First they saw Wall Street bailed out while unemployment shot up, then the era of QE and asset price inflation followed. This did little to stimulate demand, but it did create tremendous inequality as the economic pie was redistributed in favor of Capital vs Labor. Then inflation hit, which again hurt the poor and middle class the most
This popular meme reflects the generational contrast well
While many Baby Boomers, the parental generation, frequently were able to buy a house in their 30s and broadly enjoyed a sensation of advancing in life, today’s same age group is far from that, and instead needs to fight the cost-of-living-crisis

So Millennials first got screwed by QE and inflation. Now unemployment looms, which again is much harder on lower income groups. With all this in mind, it is unsurprising that there is no mood for austerity
Conclusion:
Inflation likely falls this year as the Fed hammers money supply. A decline in nominal growth stands in contrast to considerable debt growth since Covid-19, especially for governments. Cuts to entitlement programs, or health care are likely politically not feasible, nor desirable given the social impact. Thus, more liquidity will be needed
It is therefore likely that the Fed ends QT, cuts rates and/or reintroduces QE or some stealth versions thereof later this year. This possibly in the form of Yield Curve Control, which caps bond yields at nominal levels below the inflation rate
Thus, inflation likely comes back in late 2023 or in 2024, when the economic cycle accelerates again and the cyclical components of inflation return that are currently supressed or about to be suppressed by the economic downturn
What does this mean for markets?
As always, below is my personal attempt at connecting-the-dots for my own investments. Please keep in mind - I may be totally wrong, nothing is more important than risk management, and none of this is investment advice
These are my thoughts to start the year, for various asset classes:
Bonds - Should I be correct with my assumption of a hard landing and a temporary end to inflation, US Treasury bonds likely are a central trade for this year. However, near term, after a strong move, some digestion may be in the cards, especially if China’s reopen boosts commodity prices. Further, it is important to keep in mind that looking further out, substantial headwinds likely return for USTs. Once the Fed returns to QE and inflation creeps up again, bonds likely once again perform poorly, with TIPS as much preferred alternative then as real rates are supressed, possibly in a Yield Curve Control regime (I find it hard to envisage another medium-term outcome, but remain open minded)
Equities - I highlighted the upside risk to equities in my last post, as hedge fund net exposure is near historical lows while declining bond yields boost the valuation multiple. Beaten down names such as Tesla, which suffered from liquidations and tax-loss selling (see here), could see some more upside, just as much as China-related names which only recently were generally deemed “uninvestable” (= no one owns them). The US recession likely won’t arrive until next quarter, with corporate earnings significantly challenged by Q2. Until then, hopes of a soft landing can be maintained and the brave could enjoy some more upside in equities
Global Liquidity - Markets currently benefit from a benign liquidity context despite the ongoing QT. Why? The US Treasury has reached the debt ceiling, and thus cannot issue any new debt until it is lifted. Until that is resolved, which could be June or even October this year with emergency measures, the Treasury will spend down its general account, which likely, roughly offsets the liquidity contraction from QT. My suspicion is that the accordingly backed-up, looming wall of US Treasury net new issuance coincides with an end to QT (in the fall?), and thus becomes “digestible”
Commodities - China reopen should provide a further boost in particular to metals, with copper breaking out of its recent trading range. Again, we likely see a brief window of an accelerating Chinese economy, and an US economy that is not yet in the steeper stages of deceleration. I see short-term upside for commodities excl. oil, but downside from Q2 as the US, and with it the world economy slow down
Credit - Should we experience a “hard landing”, credit spreads likely widen considerably from here. Thus, it seems the moment to go all-in on high-yield and distressed debt is still ahead of us
Gold - Real rates are the key driver for gold, and they likely peaked in December (see last post), with US monetary policy likely now at/near its hawkish peak. Add to that developing nations’ desire to diversify away from the US Dollar as a result of Russia’s SWIFT-shock following its attack on Ukraine. Gold might still decline in risk-off episodes, but to me seems a key holding for the coming years
Crypto - Bitcoin is a variation of gold, so similar dynamics might apply. Legal risk however is very high following FTX, so its path is more uncertain
Looking at most recent data trends, I expect the world economy to turn up in late ‘23/early ‘24 and would expect an end of the bear market ~1 quarter before. Until then, markets likely remain challenging
Florian, thanks so much for the awesome works on labor market tightness. Would you shed some light on the source data for company size based job vacancies? Fascinating angle!
Florian, what do you see as BoE options (now/ medium term)? It looks to me like they have the worst mix of high inflation expectations and a moribund economy.