
Labor Day
Has the path been decided? Plus why I have added long US Industrials, short REITs

In recent posts I described how in a tug-o-war two currents shaped the US economy over the past months, and it appeared unclear which side would be stronger. On the one hand, the end of destocking in retail and increased demand for new single-family housing supports a resurging goods economy. On the other, the labor market showed signs of weakness, with worry about further deterioration
While Friday’s strong Non-Farm Payroll release still contained some hairy details, it appears to have decided this tug-of-war in favor of growth for now. Even if some may debate this conclusion, more importantly, market consensus will likely read it that way for some time
The implications span across asset classes, with US rates and the US Dollar at the center. A possibly cracking labor market was the biggest obstacle to a continuation of the torrid rate of US nominal GDP growth. Remove it, and the market's assumption of a substantial growth slowdown as well as the corresponding 150bps cuts priced for ‘24 as recently as this past Wednesday seem very offsides. The resulting 3.8% Fed Funds rate would be nonsensical in light of current NGDP growth of 6%, no matter the level of inflation
A higher growth context is certainly positive for many equities, in particular those with a dominant market position, scale and secular tailwinds. It also likely represents a phenomenal challenge to the weakest links of the market, such as Commercial Real Estate, Regional Banks or Unprofitable Tech, which have recovered substantially since the October lows, yet maturity walls are now closer than during last year’s yield tantrum
As always, today’s post concludes with my current outlook on markets, where I explain why I see long US Industrials, short REITs as possibly favorable expression of said dynamics
Let’s look at the details of Friday’s crucial labor market release. As always, the data had something for everyone
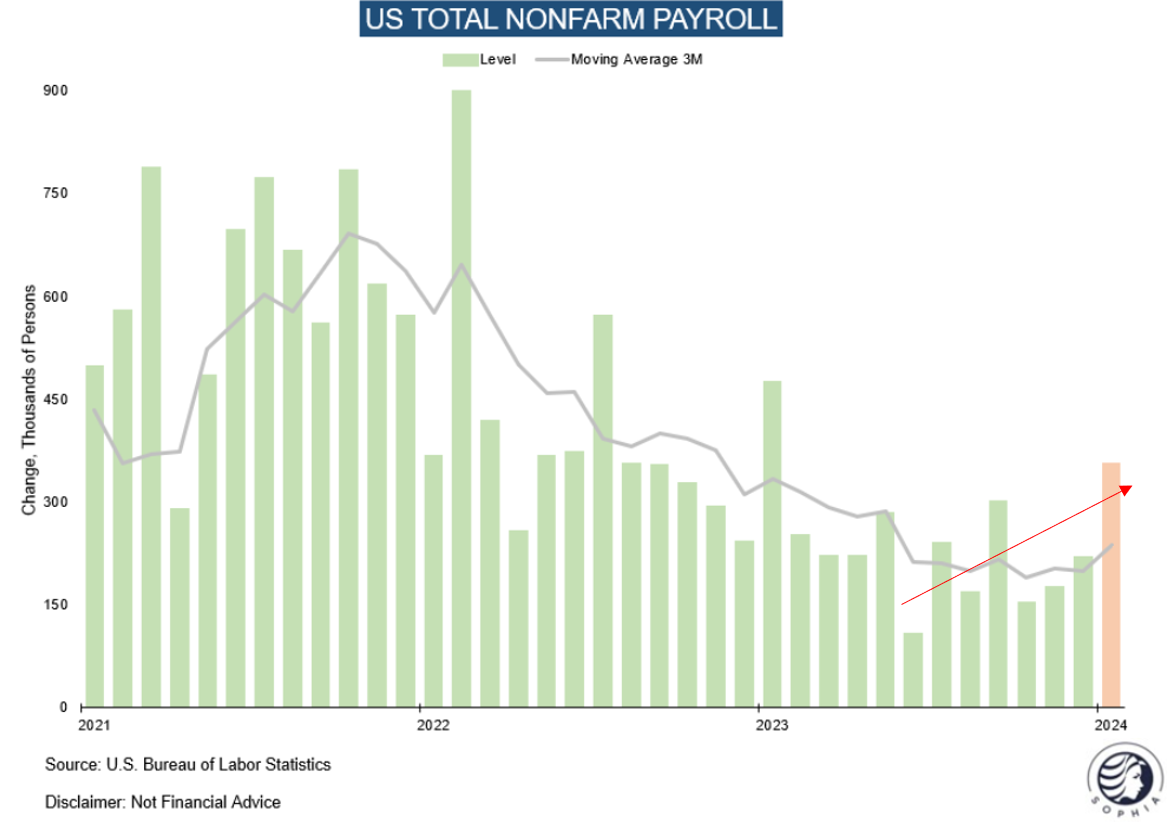
If we apply Occam’s razor and look for the simplest explanation, it tells us that the labor market is strong - the headline figure printed 300k new jobs, wage growth accelerated to 0.6% month-on-month, and the medium-term trend appears to have turned up
Under the hood, details were more nuanced, one could construct a more negative case out of them. In particular average hours worked plunged…
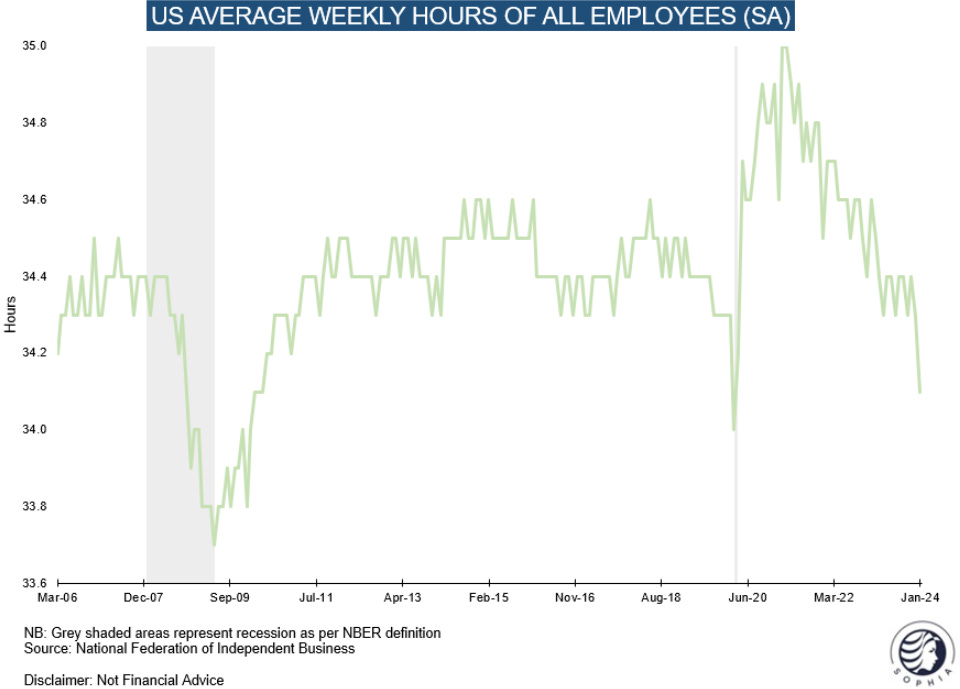
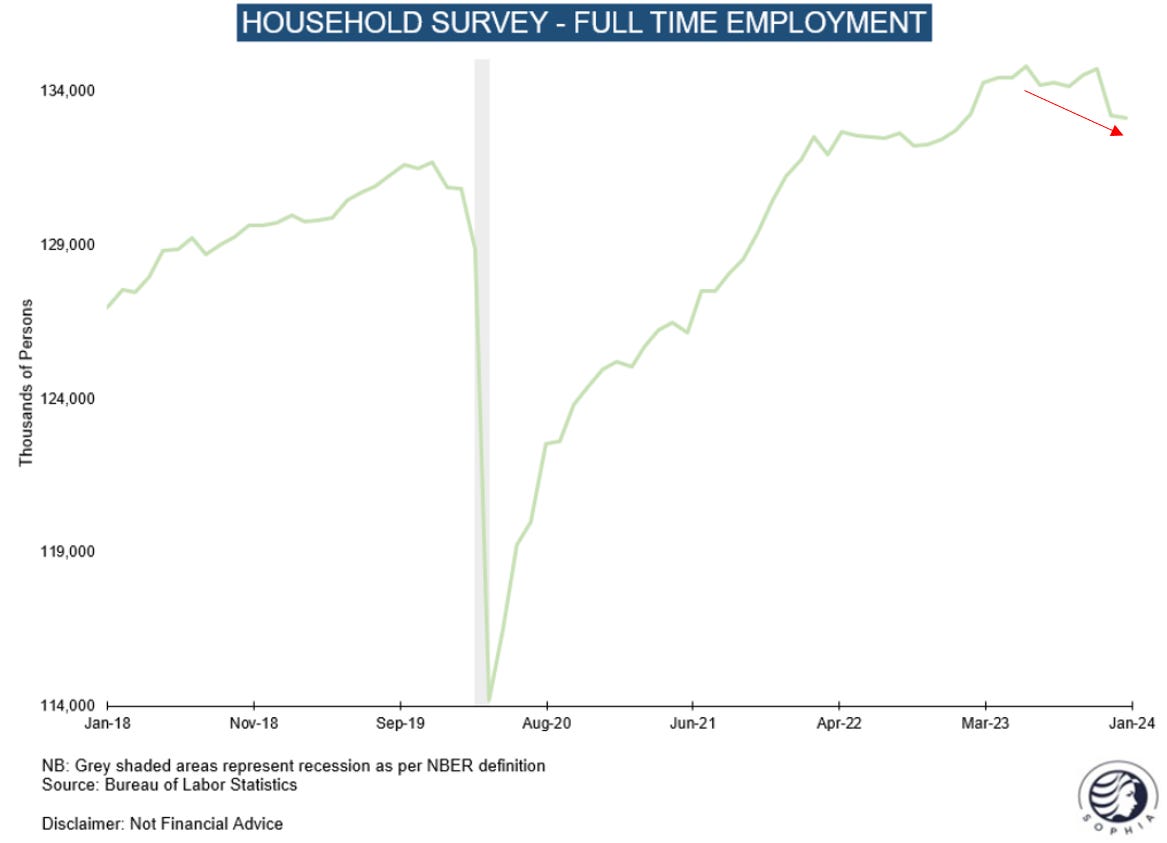
..which was likely weather related, but it probably inflated reported wage growth (which is calculated by earnings/hours worked). Further, full time employment as measured in the household survey declined, indicating an ever growing share of the gig economy, which may also explain the deterioration in some of the US Treasury data (e.g. paid out Benefits)
I am inclined to give the glass-half-full explanation the benefit of the doubt, to focus on the strong headline number, for the following reasons:
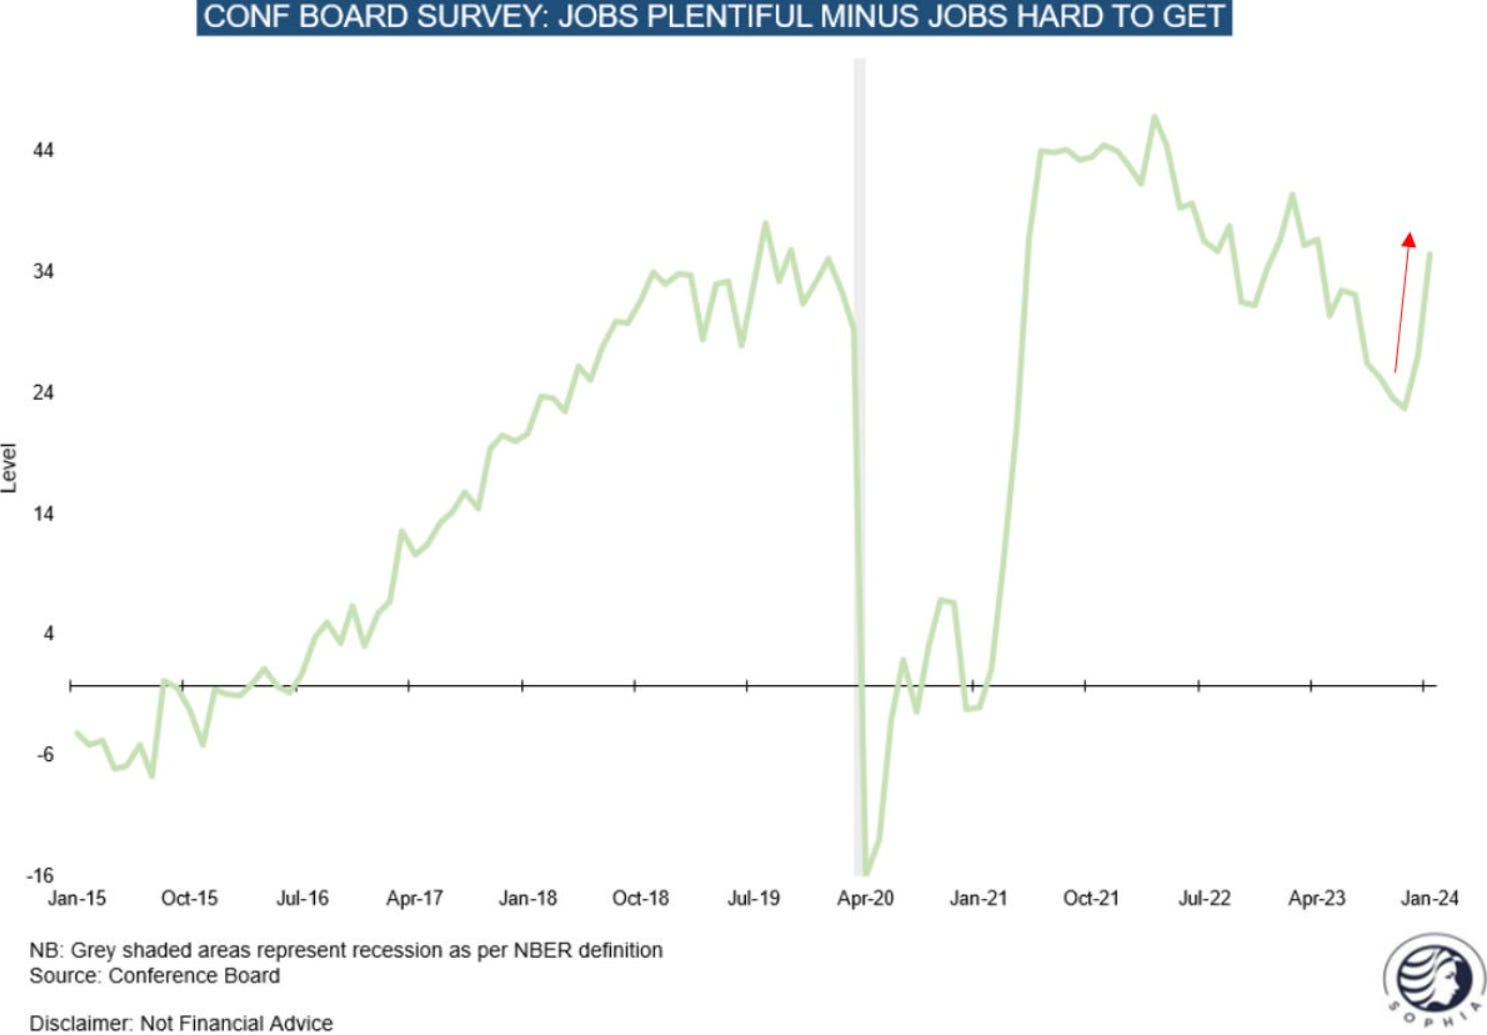
First, a recent important detail of the Conference Board survey showed consumers saw a significant improvement in their perception of the state of the labor market (I highlighted this as employment “greenshoots” in my last post)
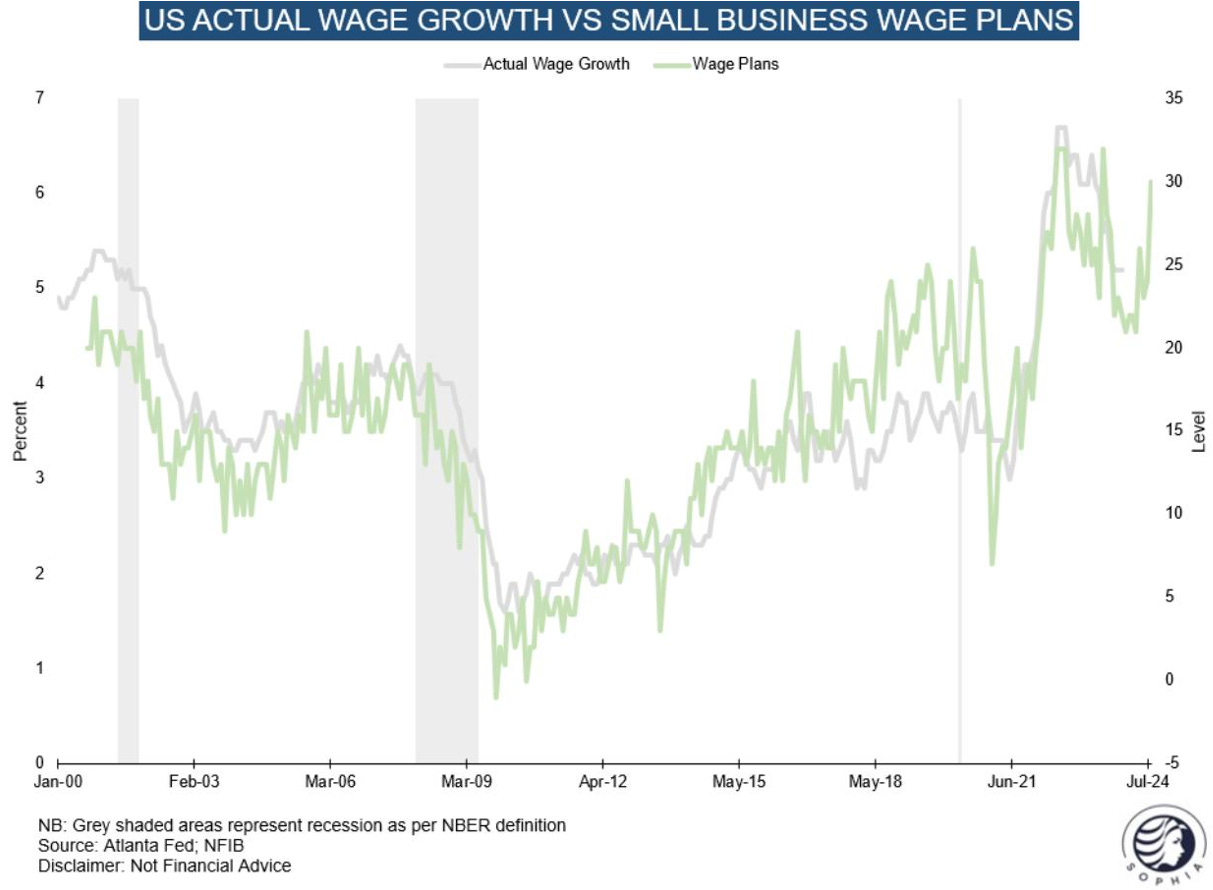
Second, the high wage growth number may not be entirely due to weather, as it had been forecast by the December NFIB small business survey, which indicated higher compensation ahead
Assuming the labor market is in decent shape, little appears to stand in the way of economic reacceleration. In fact, we see more evidence of it in the data:
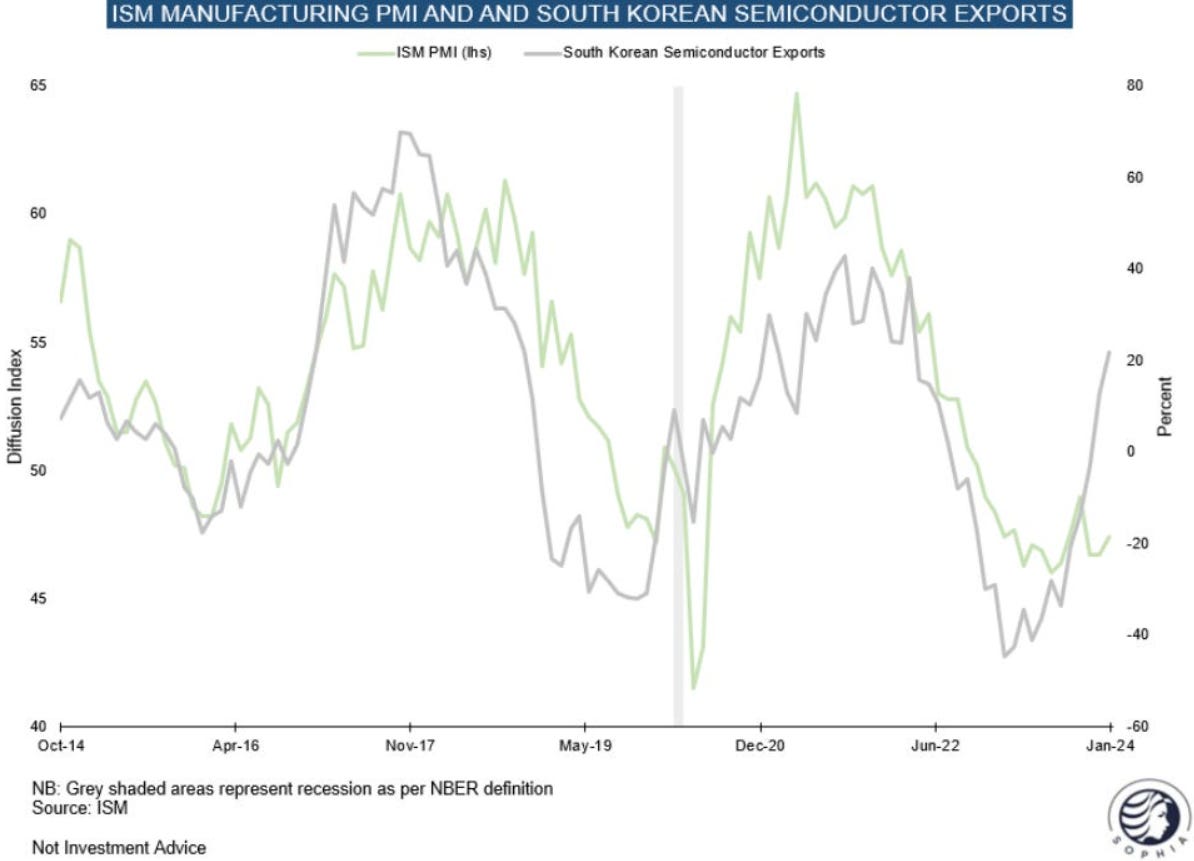
The ISM Manufacturing survey came in strong for January and remains on track to cross into expansionary territory soon (= above 50)

South Korean semiconductor exports historically lead global industrial production and are looking good (some of this is obviously AI related, but that’s also productive activity)
Finally, freight data has picked up considerably, historically a strong lead indicator for further industrial growth, and there are now signs of life in loan demand
Conclusion:
Friday’s NFP data likely has put labor market worries to bed. Whether warranted or not, the market will likely see it that way until proven otherwise
This provides the all-clear for the market narrative to pivot from slowdown worries to growth acceleration, with profound implications across asset classes
Looking further ahead, this implies two possible outcomes for the US economy:
Bull case: Growth re-accelerates, but inflation does not, e.g. because immigration keeps a lid on wage growth, or oil never rallies due to enough supply. This is the halcyon case one can dream of - I don’t rule it out at all
Bear case: Growth re-accelerates and inflation follows. This seems the more likely case given historical precedent, but it is far from certain
What does this mean for markets?
The following section is for professional investors only. It reflects my own views in a strictly personal capacity and is shared with other likeminded investors for the exchange of views and informational purposes only. Please see the disclaimer at the bottom for more details and always note, I may be entirely wrong and/or may change my mind at any time. This is not investment advice, please do your own due diligence
The economy is not the stock market, and near-term is different to long-term. Let’s walk through the near-term market implications in several steps:
A re-accelerating US economy is at odds with the current pricing of front end rates, which assumed 150bps cuts starting in March as recently as past Wednesday, while the Fed had always only guided to three cuts this year
Higher real growth also means higher nominal growth. Accordingly, the various FOMC members should revise their real GDP growth assumption for ‘24 up from 1.4%. All else being equal, this suggests that cuts start later this year, and it would be logical for 1-2 cuts to be removed from the projections
Higher US front-end rates suggest a stronger US Dollar. This may turn into a headwind for commodities and other greenback-sensitive assets
Higher US front-end rates also reduce the pressure to reallocate from short-term Money Market Funds into longer duration assets
If rates reprice upwards due to strong growth, that is not bearish equities. In fact, it is very bullish for some stocks, while negative for others. Specifically:
Businesses with a high cash balance, dominant market position and high pricing power will likely see both strong revenue and earnings growth. This includes Large Cap Tech, but also US Industrials, which also benefit from the increasingly unfolding IRA tailwind
On the flip side, last year’s weakest links of the market will come back into focus, rate-sensitive business with high leverage, too much exposure to complicated assets or a dependency on frequent new cash raises. The nexus of commercial real estate and regional banks stands out, as do multi-family assets as well as Unprofitable Tech. Note all these are considerably off their October ‘23 lows
US Small Caps, many part of these weakest links, are in a delicate situation. If the economy accelerates, cuts are priced out and they suffer. If the economy weakens, their earnings decline. As frequent “QE-legacy” businesses, their environment to thrive is some growth and very low rates. That combination seems currently unlikely
Growth acceleration is good for large caps, but having said that, I continue to see the odds that US equities have made a top last week, or are in the process of doing so
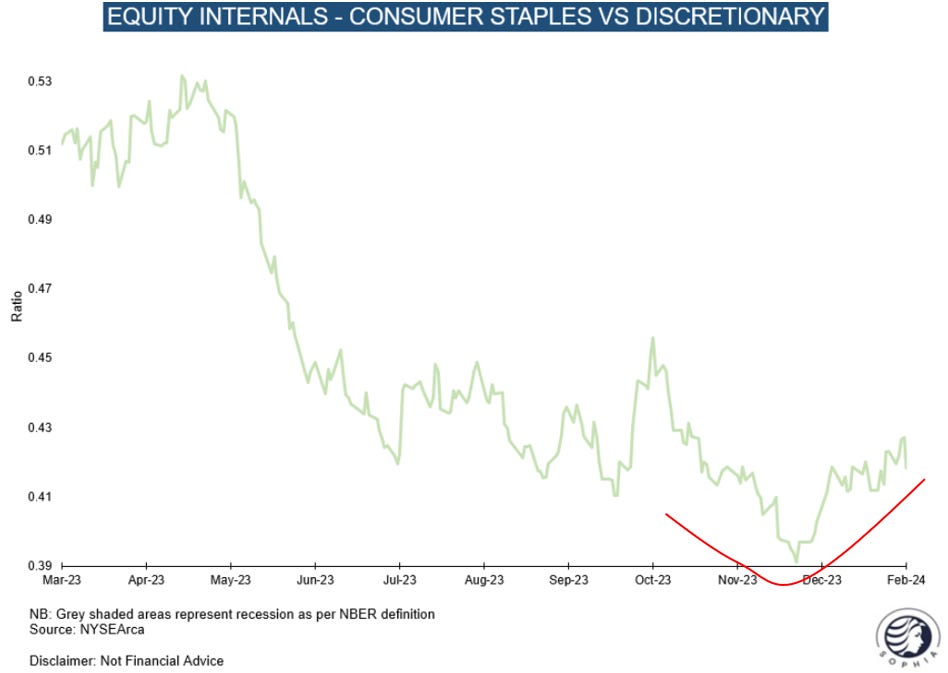
Many internal divergences that have preceded previous stock market tops are currently present (see below example for Staples starting to outperform Discretionary) so I would not be long at this stage, despite the positive backdrop for some important equity sectors
Calling a top is much harder than picking a bottom, as the latter usually involves some cathartic wash out, while the former can keep drifting up until the FOMO peters out. Hence, I realise that I may be wrong or early with this view. Also, please note that my view of a top in formation now does not mean I expect the rest of the year to be a bear market, I simply see consolidation as likely near-term
This is how I have solved the sum of these dynamics for my allocations:
Short-term book (Active Trading, Long & Short):
I have sold the long Copper and Oil majors (strong dollar) and replaced them with US Industrials (reacceleration). I replaced some of the Small Caps short with Regional Banks and Real Estate (office, multi-fam, ETFs). I have added some long US large cap banks as a hedge in case the market should continue to rise, and I have added a starter position in the “AI-Second Leg” basket. I have also added small to China, and removed the Long EU Luxury/Short Dax position. Further, European industrials also seem attractive, as a goods economy recovery would be global and everyone has given up on Europe, while indeed some AI tailwinds may be underappreciated. The VR ecosystem seems interesting given the reception to Apple’s VR headset. I haven’t acted on either yet and am still deliberating
In summary:
Long US Industrials/Short US Real Estate
Long US Large Cap Banks/Short Regional Banks
S&P 500 puts mid March
Short Small Caps/Russell
“AI-Second Leg” Basket
Long China
Long-term book (Asset Allocation for Medium & Long Term):
I have sold the 5-Year bonds kept as recession hedge, and added a 5% allocation to the “AI-Round 2” basket. I have trimmed Copper by 2%. This leaves a 77% cash position, giving plenty of flexibility for the coming months. In summary:
77% T-Bills
20% Equities (5% “AI Second Leg”, 5% DAX, 5% XLE, 2.5% S&P 500, 2.5% China Equities)
3% Commodities (Copper)
Thank you for reading my work, it makes my day. It is free, so if you find it useful, please share it!
Hi Florian, what is the definition of AI-Second Leg? Thanks.
Florian, another great call.
I think you were one of the few non-perma bears calling for caution, raising cash and calling a local top.