Rorschach Tests
On personal biases, and how to avoid them
The modern global economy is an incredibly complex organism, determined by countless reflexive feedback channels. That makes it hard to read it in real-time, but even in hindsight, it is often hard to decipher its causal relationships
On the one hand, this offers an incredibly interesting playing field for anyone with intellectual curiosity, as there is always a new relationship to discover. On the other hand, this has created an analytical body both in academia and markets rife with personal biases - when relationships are uncertain, one is prone to see whatever one wants to see
As such, analysing the economy and markets resembles one giant “Rorschach Test”, taken from the field of psychology, where the patient is asked to identify patterns in a large ink blot, with the answer supposedly revealing subconscious views
Now, where do our biases come from, and why are they so hard to get rid of? They usually reflect a mix of the following:
Upbringing - The parental kitchen table is the first, and possibly deepest exposure to one of the many possible world views. Mostly, we assume what they teach us. Sometimes, in protest, we take an opposing view
Genetics - The degree of traits such as optimism/pessimism or empathy/fear varies greatly between individuals not only by nurture. A simple example, women are on average more empathetic than men
Environment - We conform in views to the group around us. For example, someone from rural farming Texas will on average hold a very different view on big government than someone from urban academic Sweden
Life Experience - People are often more idealistic in their youth, to turn more conservative with age
Incentives - Few things are as powerful as the prospect of reward. Just ask the scientists mandated for studies by big Tobacco in the 1960s, or any CEO whose compensation is stock-based
Reviewing this short list of origins, one can easily see why biases are very entrenched - they are anchored in the deepest areas of our minds. Yet, for analysing the economy and markets, they are incredibly unhelpful as they can blind to the obvious. Particularly in markets, they can marry us to a wrong narrative while prices have long taken a different path
Today’s post illustrates how biases may influence the possible read of the current economic context using the example of US labor market data. Following that, I’ll show how positioning can help remove these biases to make a choice between competing narratives
As always, the post concludes with my current outlook on markets, where I summarise my latest stance in light of today’s analysis
The evolution of the US labor market holds the key to the global economy of 2024. I’ve laid out in “Will it hold?” in November how it appears to drift towards a more fragile state and thus warrants paying close attention to. However, the “Rorschach test” also applies here, and a glass-half-full and glass-half-empty read is possible:
First, the glass-half-full view, it can be summarised very briefly. We focus on the most important datapoint, the headline number
The latest US Jobs release showed 216’000 new jobs created in January, the highest in number in 3 months. More so, wage growth improved to 4.2% annualised, suggesting employees maintain decent wage bargaining power
Why only look at the headline? Occam’s razor, as Brent Donnelly put it well in his latest Friday Speedrun. Reduce the issue to the simplest possible explanation, in this case, the headline number
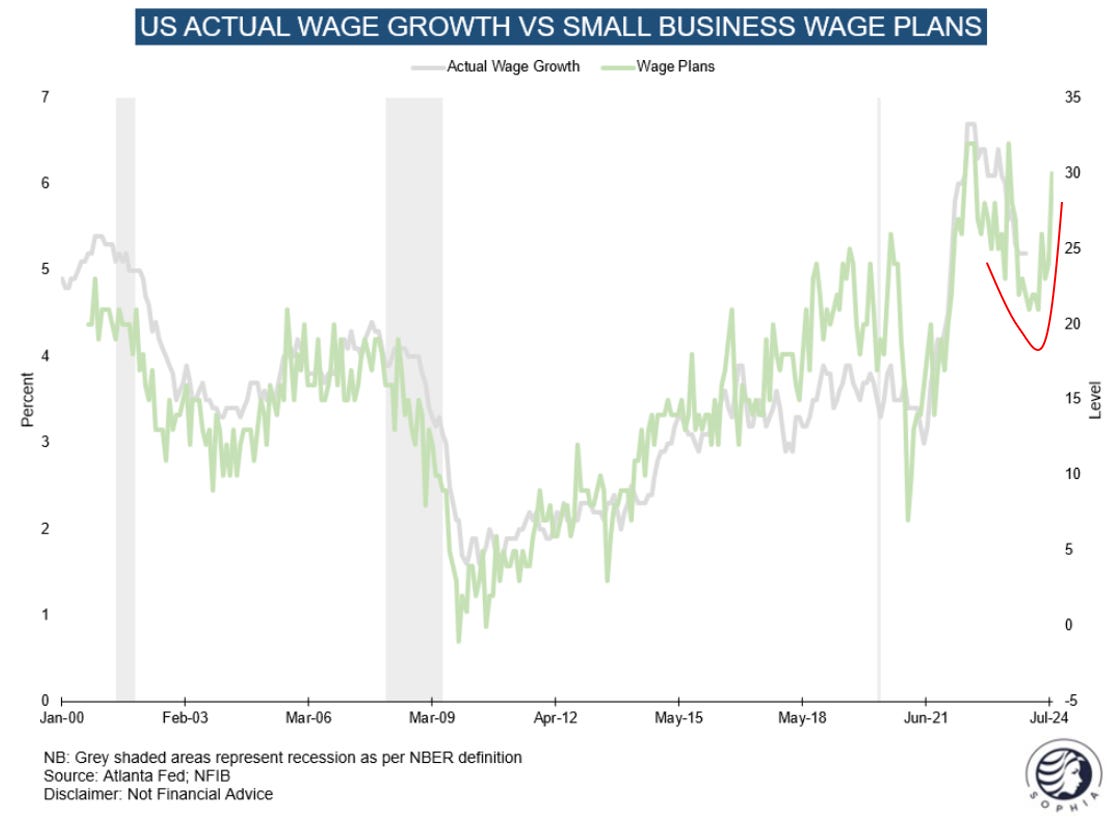
Moving away from the NFP release, some other data also suggests a healthy labor market context. Small business compensation plans are on the rise again, which have historically lead wage growth. Why would they go up if unemployment is around the corner?
Turning to the glass-half-empty view, while the NFP survey is one of the most important economic releases, it is ironically also one of the lowest-quality ones. Survey-based, it is prone to revisions, and last year’s total job growth number had just been reduced by 25%, i.e. every headline number last year was way too high (!). Looking under the hood, we see plenty of deterioration signs. Let’s walk through them:
While the most widely reported “establishment survey” that asks companies shows decent job gains, the accompanying “household survey” which asks individuals dropped to a cycle low
One of the reasons is the rising number of second jobs, which is not counted in the Household survey. I think we can agree that most people would rather only work one job, so an increase is typically a sign of some household stress
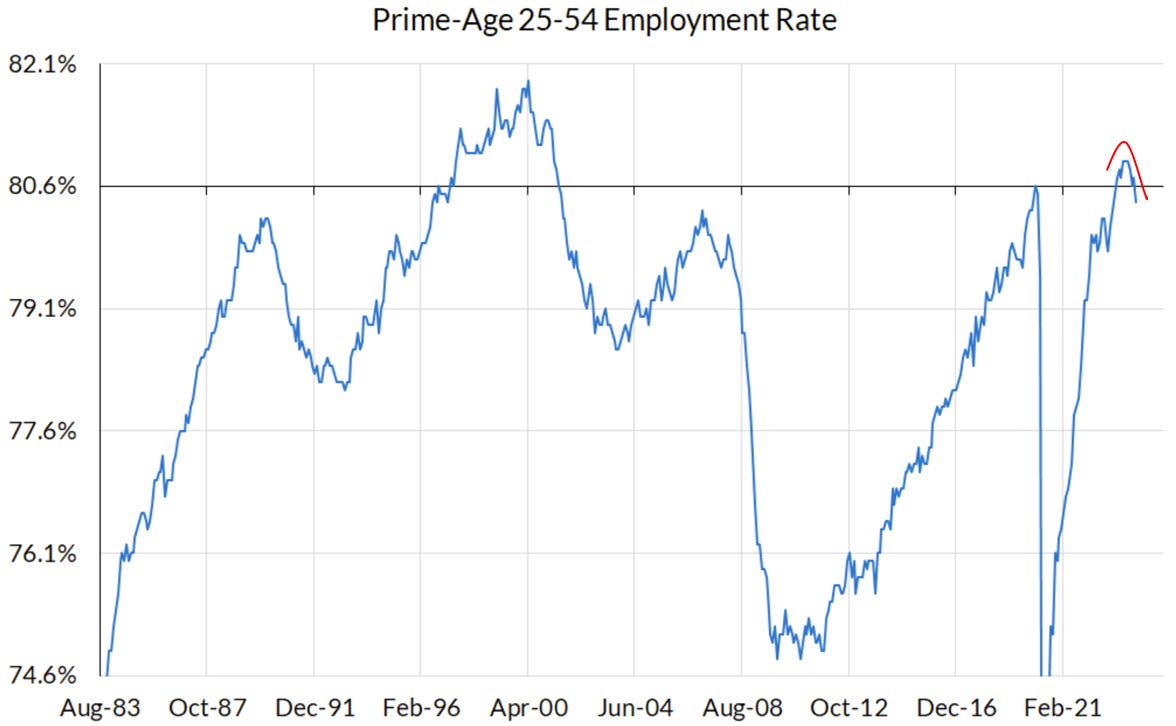
Further, the prime age employment rate declined, indicating that a growing share of able workers is again dropping out of the labor market…
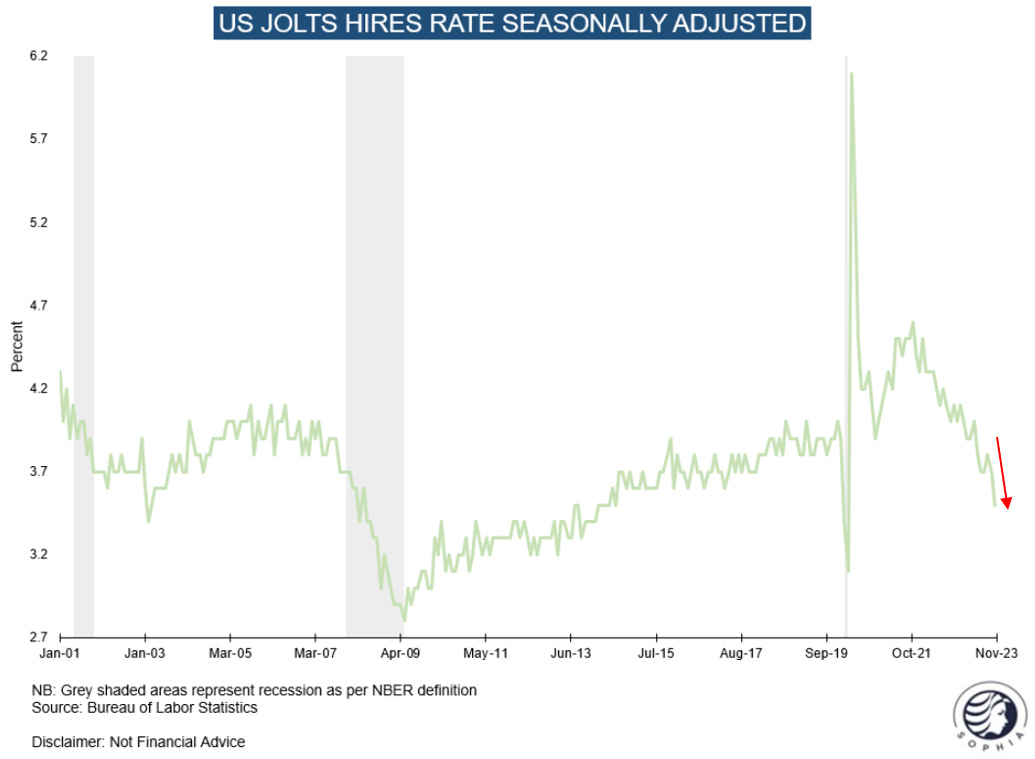
…which comes amidst a rather rapid decline in corporate hires…
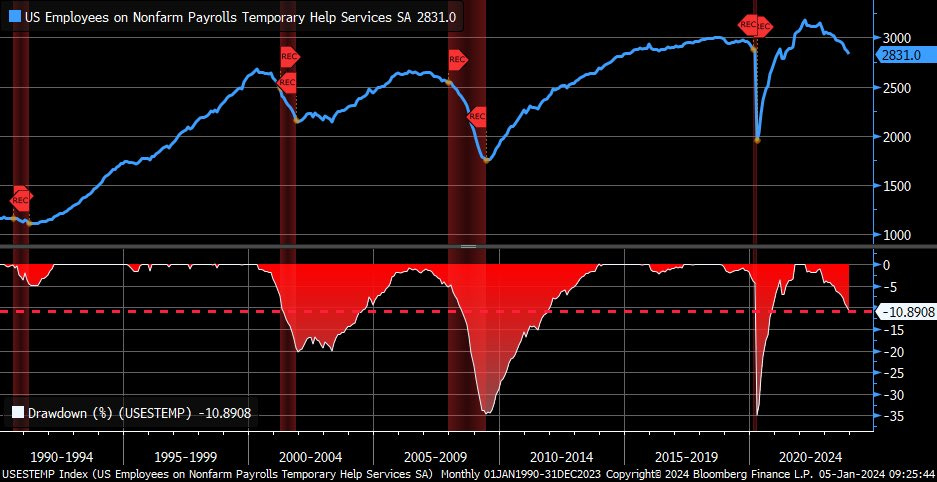
…while temporary help also dropped, which companies usually cut first…
…so it is not surprise that overtime work has also come down
Finally, the ISM Services employment component fell off a cliff, suggesting the services sector is in the process of shedding labor. As this extreme read is not corroborated by other data, it is likely overstated. But given the ISM’s decade long experience and reputation, I think it is worth paying some attention to. Add to that recent profit warnings from staffing agencies such as Hays
Summary: Both the “Glass-half-full/Occam’s Razor” and “Glass-half-empty/Under the Hood” view of the US labor market appear reasonable and compelling, yet offer very different reads of the current situation
So how to pick a side? Simple - instead of personal bias, let’s turn to the market to decide. In particular positioning should help us
In an ocean of narratives and biases, positioning can work as an objective anchor that can guide between competing narratives
Positioning only has one read, particularly at extremes. At that stage, the market has usually run out of incremental buyers or sellers, and then typically moves in the opposing direction
By pulling together positioning data across various asset classes, one can create a read for a future path of both markets and the economy, essentially by inverting the extremes
Let’s apply this to the current context
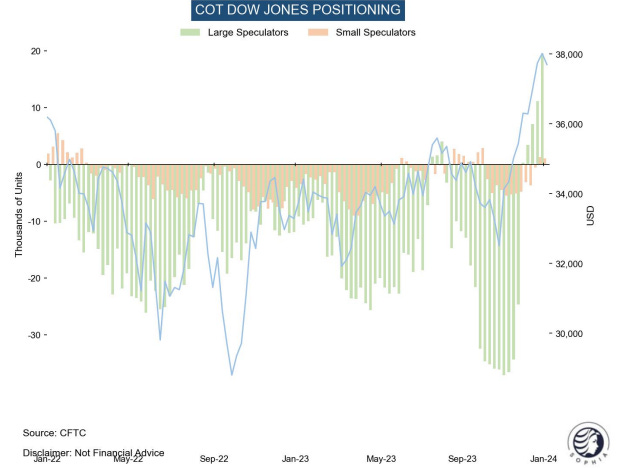
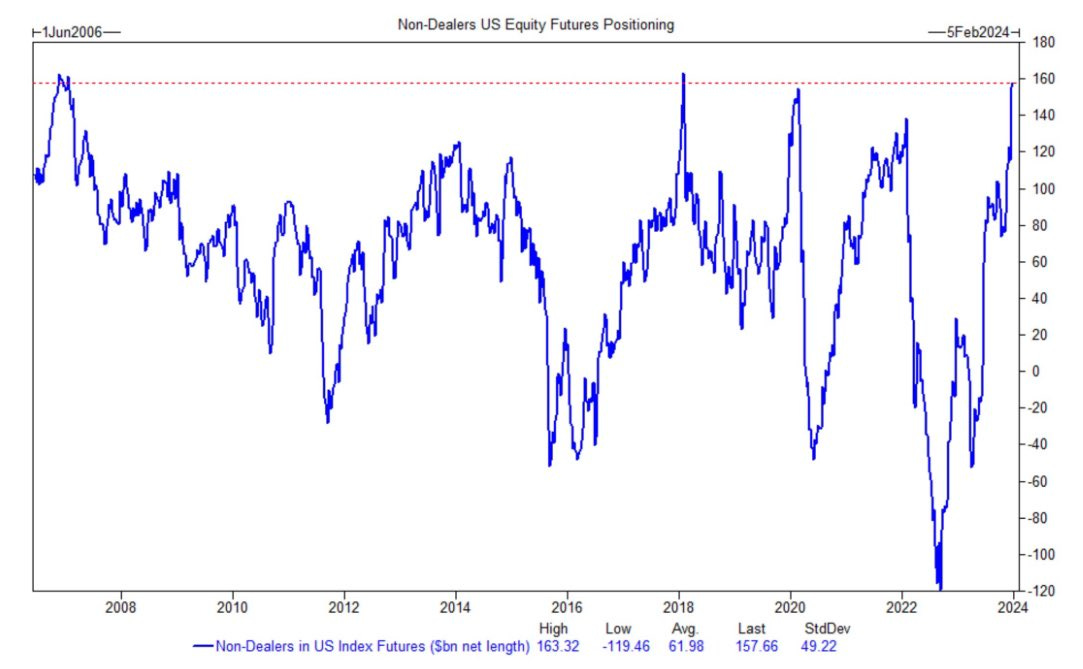
Equities: Fast money accounts as per CFTC data are currently the most long various US equity indexes in 2+ years, including the Dow, Nasdaq and Russell 2000
This is also visible in various other positioning reads
Currencies: The very long equity stance is accompanied by elevated short US Dollar exposure (chart below positive numbers = aggregate longs in EUR, CHF, GBP and JPY vs USD)…
Precious Metals: …and the highest Gold exposure in ~2 years. (also notice in the chart below how Gold exposure was at its lows just before the Israel-Hamas conflict started)
Now what does all of that have to do with the US labor market? Again, it is simple:
To repeat - extreme positioning across various assets often indicates a market move in the respective opposing directions, with some common narrative across all assets as driver
Applied to today’s case, the odds are the next market moves are weaker equities and precious metals, while the Dollar strengthens
This tells me the odds are higher that the glass-half-empty read for the labor market is more likely correct. Why?
Equity investors are all-in, suggesting further upside is less likely. In my view, this means the next series of news for equities is more likely to be negative than positive (while the inverse would apply if investors fought the recent rally by shorting it). Strong employment would suggest strong earnings and higher equity prices ahead
Now, the current positioning constellation could of course be read in various ways. An alternative:
The short Dollar and long Gold exposure could indicate that the market’s next move is towards a stronger US economy, which would take yields and with them the US Dollar higher, and Gold lower
In that case however US corporate earnings power should improve materially, with significant upside for stocks. The very long equity positioning tells us that equity upside is less likely, thus that case might also be less likely
Conclusion:
There are many ways to interpret economic data, and often personal biases are the deciding factor between competing narratives
Instead of personal biases, positioning can be used to choose between competing explanations. This can be done by inverting extreme investor positioning, and essentially backsolving from there on the economic path ahead
Said approach takes into account the countless reflexive feedback mechanisms between the economy and markets, where an economic truth usually ceases to exist the moment markets price it in
Current cross-asset positioning suggests markets may underestimate economic downside risks, which implies the glass-half-empty read of the US employment situation is more likely
What does this mean for markets?
The following section is for professional investors only. It reflects my own views in a strictly personal capacity and is shared with other likeminded investors for the exchange of views and informational purposes only. Please see the disclaimer at the bottom for more details and always note, I may be entirely wrong and/or may change my mind at any time. This is not investment advice, please do your own due diligence
I have not materially amended my positioning since the last post:
Small long some producers of commodities with very tight supply/demand balances, hedged with a Russell 2000 short
Equity downside exposure via index put spread with Spring expiry
Cash (i.e. T-bills)
I am waiting for good entries on:
Robotics/Humanoids
Further:
I had bought US 2-year exposure after past Friday’s NFP data, but sold it again as I see some upside risk to the coming CPI number, with inflation swaps trading meaningfully above sellside consensus estimate
I notice that Healthcare, Staples and Utilities which I called out in my last post are the best performing sectors of the year so far
The first five days are often a blueprint for the remainder of the year and were messy. This suggests we might face a pretty complicated 2024 in asset markets
The US Dollar appears to have upside vs other G7 currencies. With most of them in easing mode, I am hard pressed to not see an eventual strong bid into real assets, whenever the economic cycle permits, i.e. whenever the market gains confidence in a real demand upturn
If my view on downside risks to economic growth is wrong, then that moment would already be now. As discussed above, positioning appears to speak against this view, but I could be wrong
Thank you for reading my work, it makes my day. It is free, so if you find it useful, please share it!








It makes some sense to let positioning, as a jury, decide between two conflicting theories or narratives, the problem is timing. Large specs can be at extremes for quite some time. Not a drawdown I would welcome.
where can I find pricing on "inflation swaps"?