On Real Rates
And why I see odds for "risk off" in the coming weeks
Today’s post discusses US real rates. These have reached their highest level in 15 years, and it is very important for anyone following the economy and capital markets to understand why
Let’s recall: Real rates are the yield paid on government bonds after inflation is deducted. If the US 30-year Treasury bond pays 5% interest, and the market expects inflation to average 2.5% over that periods, then that real yield is 2.5%
Most of the time, real rates are simply a reflection of economic growth, or specifically, real GDP growth expectations. However, in the case of an excessive government budget deficit, they can also rise because there is too much bond issuance. The former is good as it reflects a healthy economy, the latter sets off a crisis as issuance crowds out capital from other asset markets, setting off the reflexive downward spiral I detailed in “On Listening to the Market”
Currently, the US experiences both possible explanations. Economic growth is exceptionally strong (Q3 real GDP ~+4-5%). The deficit is also very high, so lots of Treasury bonds are to be issued. So which one is it? I explore the answer using history as a guide
As always, the post concludes with my current views on markets, where I discuss why inflation-linked Treasury bonds (TIPS) are likely soon attractive. My stance remains the same, I am in interest-paying cash and have further added to equity downside exposure via puts, as I now see increased odds for risk-off in the coming weeks
To start, we first split the main driver of real rates, economic growth, into its two long-term engines: (1) an expanding labor force and (2) improving productivity
Why these? It’s simple: (1) the more people work, the more can be produced. And (2) The more productive they are, the more can be produced in a given time
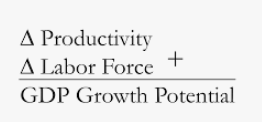
As a next step, we compare historic periods with similar labor force and productivity growth to today. If today’s level of real rates is higher than what the historical analogy suggests, then issuance is likely the driver, and vice versa
Let’s dive in:
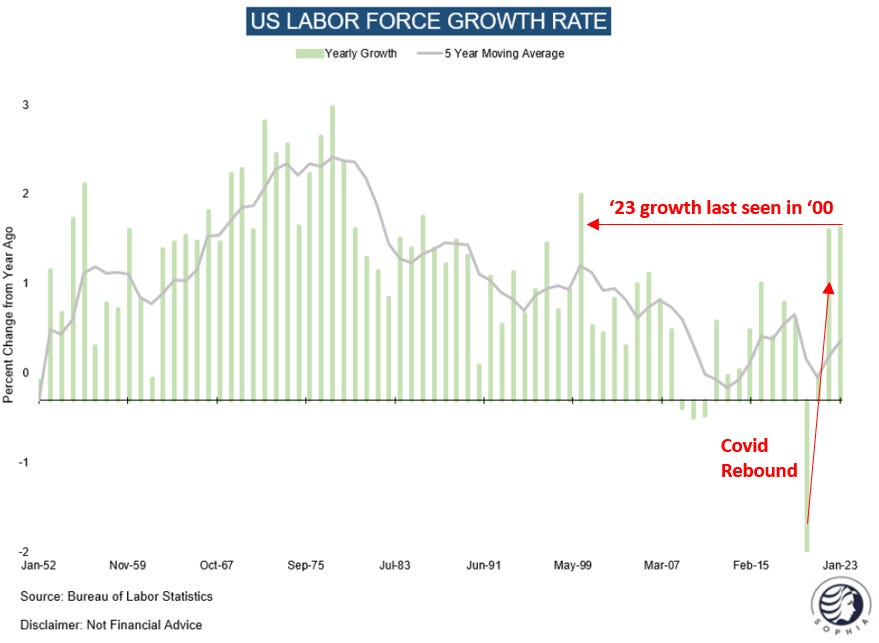
The amount of Americans able to work (“Civilian Noninstitutional Population”) is driven by population growth, which is in a secular downtrend
The 5-year average is at a long-term low - people simply have fewer babies than in the past. Immigration offsets this trend to some degree, which is much worse in many Asian and European countries
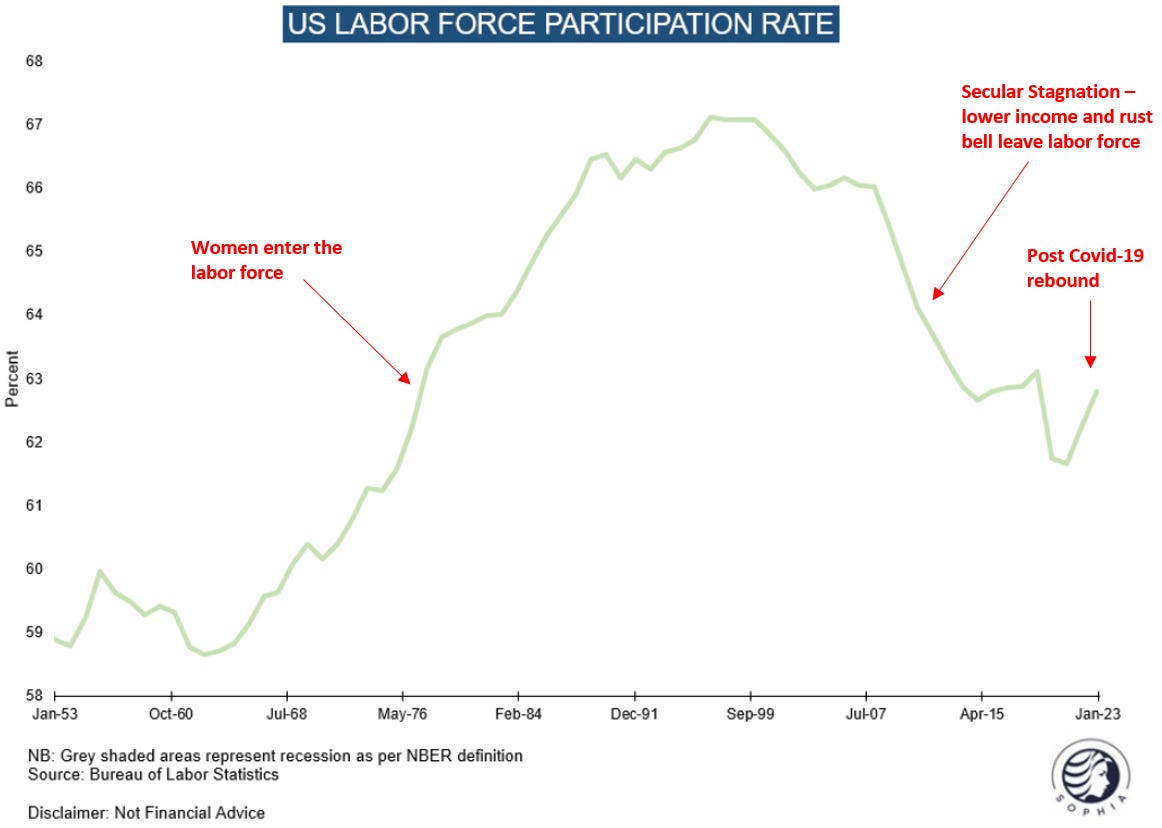
But not everyone who is able to work wants to work, for good or bad reasons. So the actual US labor force is a subset of the Civilian Noninstitutional Population. That can be expressed as participation rate
Looking at the chart below, we notice a huge increase in the labor force participation rate from the 1960s to the late 1990s. During that time, many women entered the labor force
After the Great Financial Crisis, a steep decline occurred. This period of secular stagnation confronted especially lower income groups with a dissatisfying opportunity set, and many turned their back on work
However, those who left during Covid-19 have now come back. Thus, the US labor force has actually expanded at a healthy pace in ‘22 and ‘23
The big question is - have we just filled the Covid-19 hole and further labor force growth is capped from here? Or is there a chance that those return who permanently left the labor force during secular stagnation?
Summary: Demographics are a clear headwind for real growth, the long-term trend is down. But the reservoir of employable people outside the labor force is still large, drawing them in could provide a temporary tailwind for the a few years. It is uncertain whether that occurs
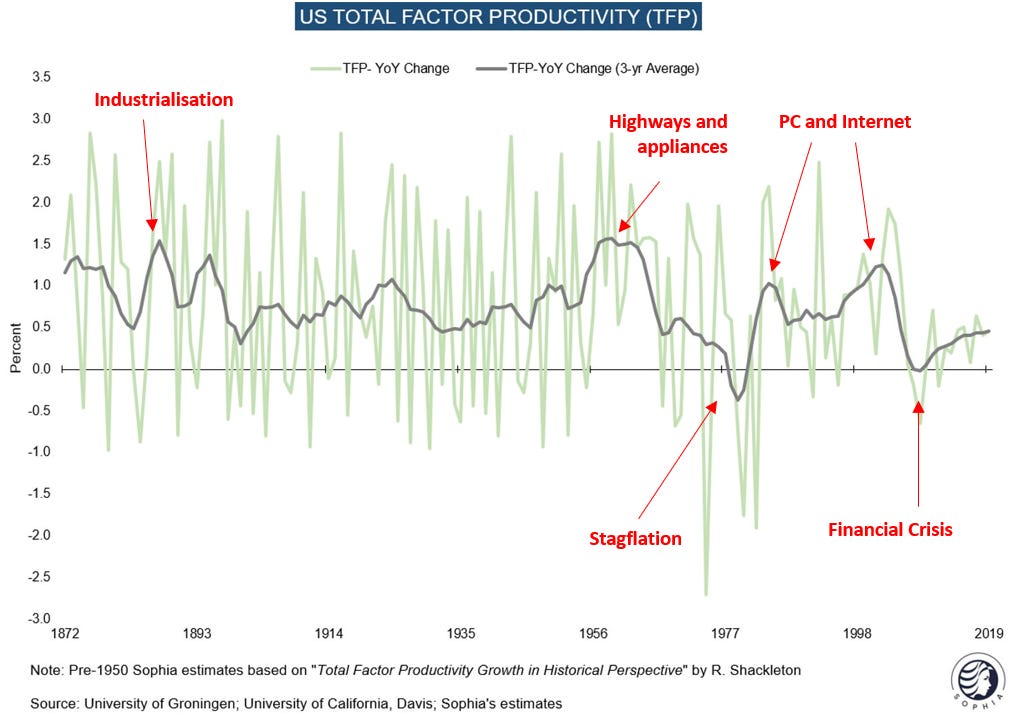
Productivity is the other driver for real growth and thus real rates. Inflationary periods (as the one we are in now) typically see low productivity growth, as capital and labor are misallocated. However, there is also AI
The PC in the 80s and the internet in the 90s added c. 1% p.a. to GDP growth for several years. In the 1960s, the interstate highways system and kitchen appliances such as fridges or washing machines provides a similar boost
Will AI do the same? It is very possible, yet it may take some time. I would expect notable economy-wide effects from '25 onwards1
Finally, productivity suffers if an economy is overlevered, as cash flows go to debt service instead of investments. The very high levels of private sector debt following the GFC drove real rates below zero for the best part of the past decade
Today, large parts of the US economy have no leverage issue, in particular households and large corporations. For small caps, the picture is more challenging, they haven’t termed out debt as aggressively and are generally more levered
Keep in mind, as laid out in recent writing, I am very focussed on small caps, which employ 50% of Americans, and have recently broken important trends (see “On Listening to the Market”)
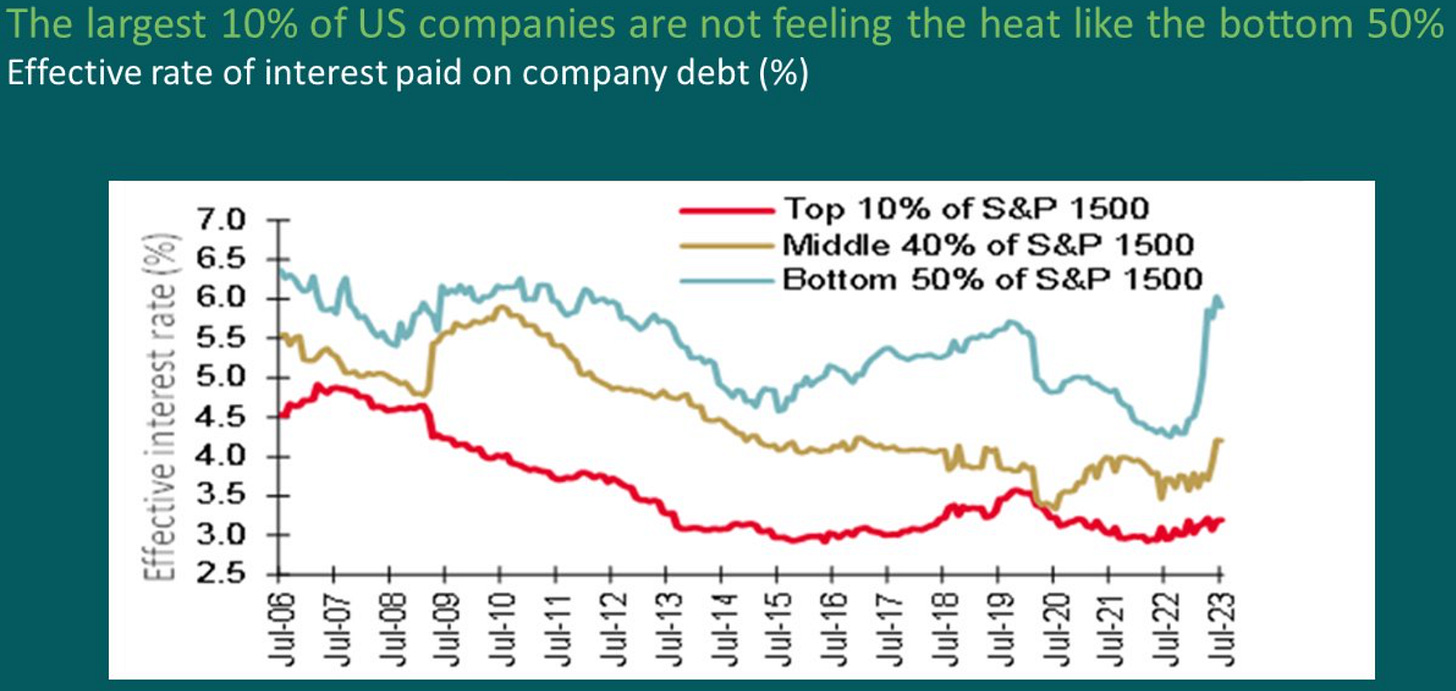
Summary: Inflationary times correspond to low productivity and small cap leverage may weigh. On the other hand, AI likely provides a significant boost to productivity, but it will likely take some time
Putting everything together, real rates are as high as they last were in the early 2000s. Is that level justified, or is it due to too much debt issuance?
Labor force growth is certainly slower than in the early 2000s. However, there is a possibility that people who left during secular stagnation could be drawn back in, offsetting the decline owed to demographics for some time
Productivity could receive a boost from AI, but this may only come some years out. On the other hand, productivity is typically low during inflationary periods as capital has been misallocated. On balance, it is probably lower now than in the early 2000s, but may improve from ‘25 onwards
Taking all this together, today’s economic context appears weaker than the last time real rates were at a similar level. Labor force growth is likely lower and productivity also likely lower, at least until AI shows a broad impact. However, the level would not be entirely implausible if more people are drawn into the labor force. Will that happen?
To answer this, I return to the analysis shared earlier this week, about what the market tells us for the US economy ahead. It tells us that at the very least a slowdown, and *possibly* a recession lies ahead, as many important trends have been broken
As I learned the hard way, one shouldn’t lean against the market. So I tend to accept that outlook. It is futher reflected in my positioning analysis, which suggests equity downside, bond downside and safe haven upside (see here and here) and also implies a weaker economic context
All this makes me think the period ahead is not one where more people are drawn into the labor force. Instead, at the very least the risk may be that the opposite happens
Conclusion: Real rates are likely too high for the current economic context. A fair share of their rise is likely due to Treasury bond supply and thus likely damaging to economic growth
What does this mean for markets?
The following section is for professional investors only. It reflects my own views in a strictly personal capacity and is shared with other likeminded investors for the exchange of views and informational purposes only. Please see the disclaimer at the bottom for more details and always note, I may be entirely wrong and/or may change my mind at any time. This is not investment advice, please do your own due diligence
If my take is correct, there will be a point that is likely very close, where the odds are high that inflation-protected Treasuries (a.k.a. TIPS) are a great buy. Current real rates are likely too high for the US economy. If that is correct it is then very unlikely that they stay that way. Eventually government action will supress them, as no one wants the economy to blow up
TIPS are an immediate reflection of real rates, so if these go down, the price of TIPS bonds goes up. Aside from betting on the price, they also provide good income. At currently 2.5% real rate for the 10-year TIP, you get that plus the inflation rate. If the CPI averages, say, 3.5%, over the period, that is a risk-free 6% yield (!)
I plan to buy these in the coming weeks when the Treasury tantrum I closely covered for the past months possibly reaches its apex. Please keep in mind, I may change this plan at any time, something entirely different may happen, or I may be wrong in both thesis or timing
It is also notable that Gold, which trades closely to real rates, has already taken off to the races, as has the Swiss Franc. It could be an indication that a peak in real rates is near, even if this bid is clearly related to events in Israel for now
Finally, it appears to me that the odds are lining up for a larger downside move in equities (“risk-off”) as long-term Treasury yields bonds continue their advance (see Red Alert for details)
Even if they stalled here (I see little reason why aside of risk-off), as discussed today, real rates are likely too high. Markets always front-run what lies ahead, so an economic slowdown could quickly be priced in
The market would then want to see the Fed change course, which it may only do if there is a pretext such as significantly lower asset prices. This could get us into a reflexive loop where stocks need to fall further, until they reach a level that has caused enough damage so the Fed can act. Whenever that happens, a rally should ensue. I hope to catch that moment to go long risk. I may miss it, it may already happened, I may be wrong - the future is uncertain
Until then, I’m still positioned the same. Interest-bearing cash since mid-September and puts to bat for equity downside. I have added to these as it appears the odds now favor risk off ahead, especially after this week’s large Options expiry rolls off
Thank you for reading my work, it makes my day. It is free, so if you find it useful, please share it!
DISCLAIMER:
The information contained in the material on this website article is for professional investors only and for educational purposes only. It reflects only the views of its author (Florian Kronawitter) in a strictly personal capacity and do not reflect the views of White Square Capital LLP and/or Sophia Group LLP. This website article is only for information purposes, and it is not intended to be, nor should it be construed or used as, investment, tax or legal advice, any recommendation or opinion regarding the appropriateness or suitability of any investment or strategy, or an offer to sell, or a solicitation of an offer to buy, an interest in any security, including an interest in any private fund or account or any other private fund or account advised by White Square Capital LLP, Sophia Group LLP or any of its affiliates. Nothing on this website article should be taken as a recommendation or endorsement of a particular investment, adviser or other service or product or to any material submitted by third parties or linked to from this website. Nor should anything on this website article be taken as an invitation or inducement to engage in investment activities. In addition, we do not offer any advice regarding the nature, potential value or suitability of any particular investment, security or investment strategy and the information provided is not tailored to any individual requirements.
The content of this website article does not constitute investment advice and you should not rely on any material on this website article to make (or refrain from making) any decision or take (or refrain from taking) any action.
The investments and services mentioned on this article website may not be suitable for you. If advice is required you should contact your own Independent Financial Adviser.
The information in this article website is intended to inform and educate readers and the wider community. No representation is made that any of the views and opinions expressed by the author will be achieved, in whole or in part. This information is as of the date indicated, is not complete and is subject to change. Certain information has been provided by and/or is based on third party sources and, although believed to be reliable, has not been independently verified. The author is not responsible for errors or omissions from these sources. No representation is made with respect to the accuracy, completeness or timeliness of information and the author assumes no obligation to update or otherwise revise such information. At the time of writing, the author, or a family member of the author, may hold a significant long or short financial interest in any of securities, issuers and/or sectors discussed. This should not be taken as a recommendation by the author to invest (or refrain from investing) in any securities, issuers and/or sectors, and the author may trade in and out of this position without notice.
One also has to note that productivity dropped in the aftermath of Covid-19 due to work-from-home and fire-hire. A large number of lay-offs followed by an equally large number of new hires meant that time had to be spent training new staff. We may see some productivity gains in the coming year as work returns to the office and new staff as run up the learning curve. However, overall, this should be a minor effect



I enjoyed reading this. I very much like the fundamental analysis you do, and then your nod towards the fact that the market is very rarely wrong.
I must admit that the very high short-term inflation rates made me think that real rates were actually lower than it seems they are.
Thanks. I see there's a 5 yr TIP auction this morning. So I put in an order as a starter position.